| Type | Description | Contributor | Date |
|---|---|---|---|
| Post created | Pocketful Team | Jul-01-24 | |
| Add internal links | Nisha | Feb-17-25 | |
| Add internal links | Nisha | Feb-17-25 | |
| Add internal links | Nisha | Feb-17-25 |

- Blog
- best tyre stocks in india
Top Tyre Stocks in India
The Indian auto industry is a powerhouse, driven by a thriving tyre sector that keeps its wheels turning. For investors seeking to get in on the action, tyre stocks can provide a stable journey with solid growth opportunities. But with several major players, where do you begin?
No worries, in today’s blog we will deeply do a comparative analysis of the top 5 tyre stocks in India.
By including the focus on best tyre stocks in India, you’ll have a clearer understanding of which companies stand out in terms of market performance, innovation, and investment potential.
MRF
MRF is an Indian multinational tyre manufacturing company with its headquarters in Chennai, Tamil Nadu. Founded in 1946 by K.M Mammen Mappillai, it started as a toy balloon manufacturing unit and has grown into a tyre giant. The company manufactures a wide range of products including tyres for two-wheelers, cars, trucks, and even aeroplanes. They are also into the manufacturing of tyres, treads, tubes, conveyor belts, paints and toys.
MRF is the largest tyre manufacturer in India and ranks among the top 20 globally. They are well-recognised for their high-quality tyres and extensive reach across the country.
It was incorporated as a private company, Madras Rubber Factory Limited, and began tyre production in partnership with an American company, Mansfield Tire & Rubber Factory.
MRF has a wide distribution network in India, serving retail stores, dealerships, and car manufacturers. The company sells tyres directly to manufacturers (B2B) for factory use and also has a strong presence in the replacement tyre market for individual consumers (B2C).
They achieve this reach through an extensive network of franchised stores and dealers. The company focuses on offering excellent customer service through initiatives like roadside assistance programs and informative resources on its website.
MRF Consolidated Financial Statements
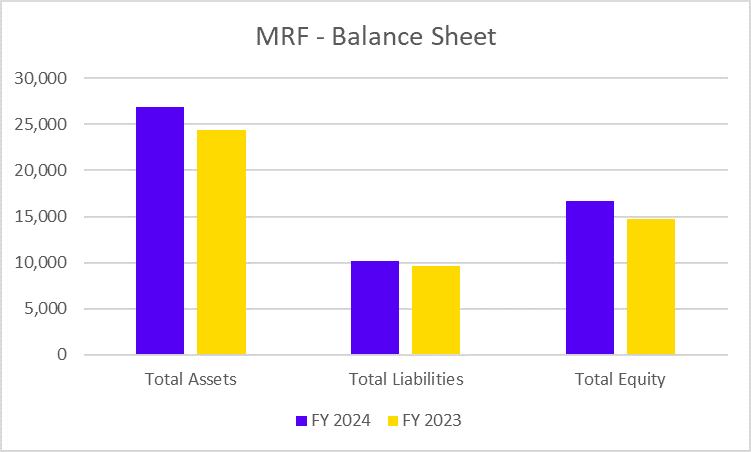
MRF Balance Sheet
| Key Metrics | FY 2024 | FY 2023 |
|---|---|---|
| Total Assets | 26,849 | 24,369 |
| Total Liabilities | 10,146 | 9,662 |
| Total Equity | 16,703 | 14,708 |
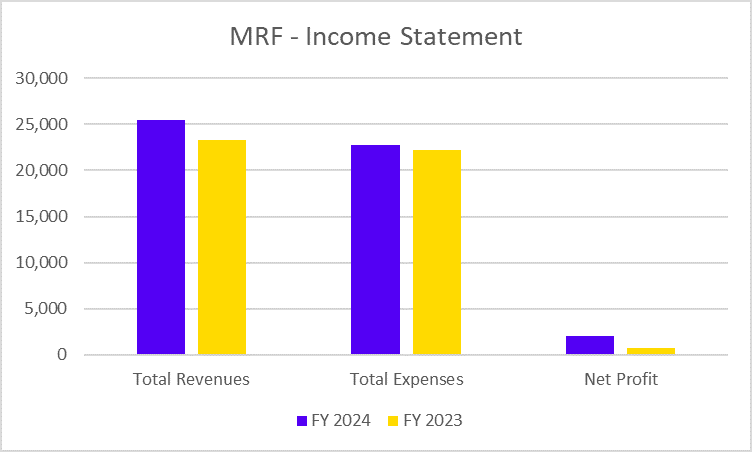
MRF Income Statement
| Key Metrics | FY 2024 | FY 2023 |
|---|---|---|
| Total Revenues | 25,486 | 23,261 |
| Total Expenses | 22,699 | 22,191 |
| Net Profit | 2,081 | 769 |
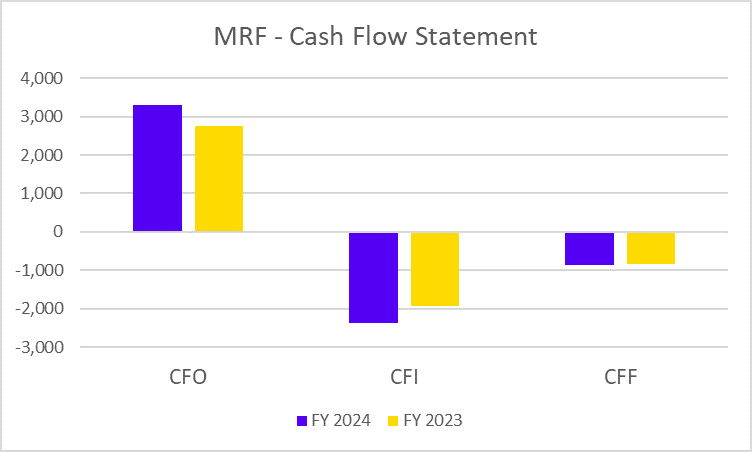
MRF Cash Flow Statement
| Key Metrics | FY 2024 | FY 2023 |
|---|---|---|
| CFO | 3,301 | 2,755 |
| CFI | -2,379 | -1,923 |
| CFF | -868 | -840 |
Balkrishna Industries
Balkrishna Industries Limited (BKT) is an Indian company that makes tyres for different types of vehicles and industries. They focus on off-highway tyres. The company was founded in the year 1987 and is headquartered in Mumbai. The company products include agriculture, industrial, and OTR tyres, as well as tubes and carbon black.
The company’s expertise lies in manufacturing Off-Highway Tyres (OHT) for agricultural, industrial & construction, earthmovers & port, mining, forestry, and All-Terrain Vehicles (ATV). They have five modern production facilities in India located in Aurangabad, Bhiwadi, Chopanki, Dombivali, and Bhuj.
Balkrishna Industries Consolidated Financial Statements
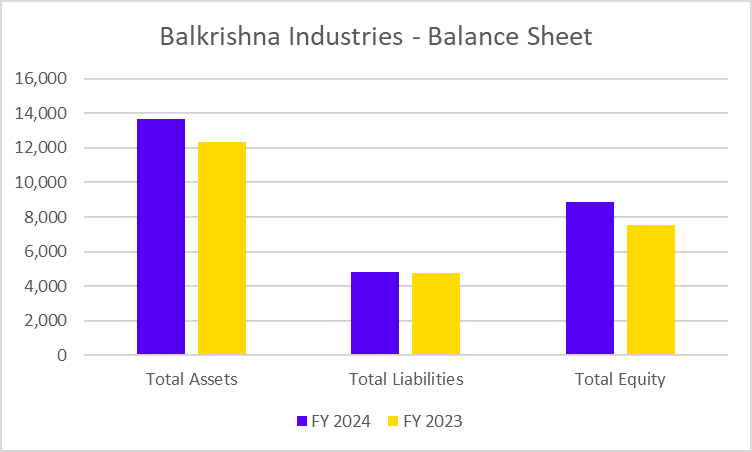
Balkrishna Industries Balance Sheet
| Key Metrics | FY 2024 | FY 2023 |
|---|---|---|
| Total Assets | 13,684 | 12347 |
| Total Liabilities | 4,830 | 4,790 |
| Total Equity | 8,853 | 7,556 |
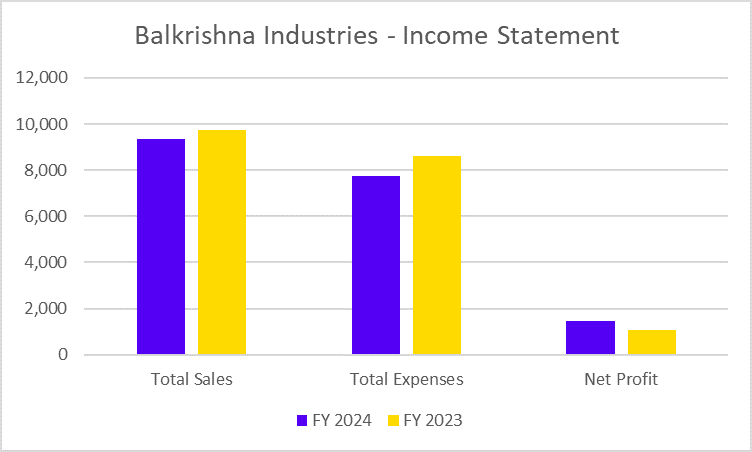
Balkrishna Income Statement
| Key Metrics | FY 2024 | FY 2023 |
|---|---|---|
| Total Sales | 9,368 | 9,759 |
| Total Expenses | 7,764 | 8,623 |
| Net Profit | 1,471 | 1,057 |
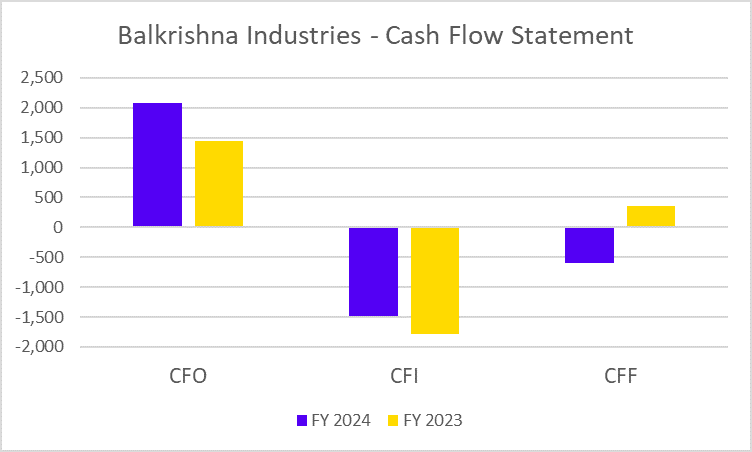
Balkrishna Cash Flow Statement
| Key Metrics | FY 2024 | FY 2023 |
|---|---|---|
| CFO | 2,082 | 1,447 |
| CFI | -1,475 | -1,783 |
| CFF | -601 | 358 |
Read Also: MRF vs Apollo Tyres: Which is Better?
Apollo Tyres
Apollo Tyres Limited is an Indian multinational tyre manufacturing company headquartered in Gurgaon, Haryana. The company was established in the year 1972 by Onkar Kanwar, and since then it has grown from a domestic Indian company to a global tyre manufacturer with a presence in over 100 countries. Apollo caters to a wide range of segments, including passenger vehicles, two-wheelers, trucks, buses, and light trucks.
In the 1990s, Apollo Tyres expanded globally with an ambitious strategy. The company acquired manufacturing facilities in the Netherlands in 2009 to better serve the European market.
The company employs a multifaceted business model, wherein it successfully integrates manufacturing, branding and a customer-centric approach. This strategic blend enables the company to effectively compete in the highly competitive global tyre market.
Apollo Tyres Financial Statements
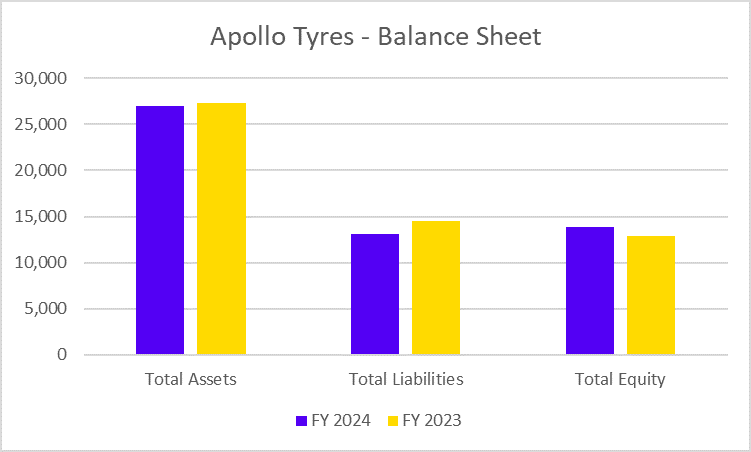
Apollo Consolidated Balance Sheet
| Key Metrics | FY 2024 | FY 2023 |
|---|---|---|
| Key Metrics | FY 2024 | FY 2023 |
| Total Assets | 26,957 | 27,359 |
| Total Liabilities | 13,054 | 14,481 |
| Total Equity | 13,901 | 12,877 |
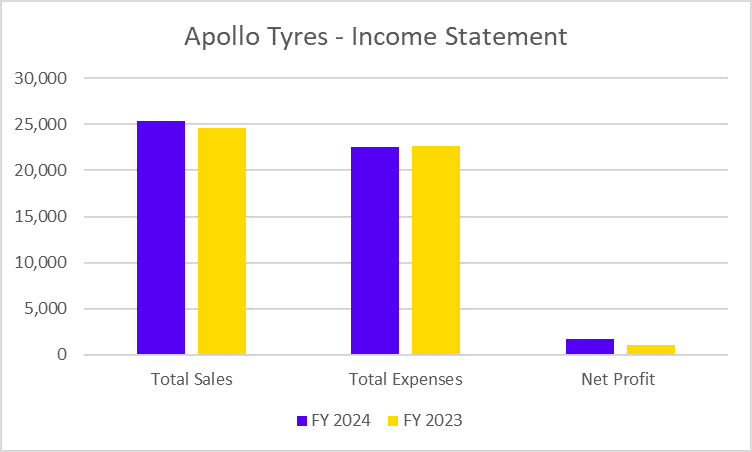
Apollo Tyres Income Statement
| Key Metrics | FY 2024 | FY 2023 |
|---|---|---|
| Total Sales | 25,377 | 24,568 |
| Total Expenses | 22,485 | 22,651 |
| Net Profit | 1,721 | 1,104 |
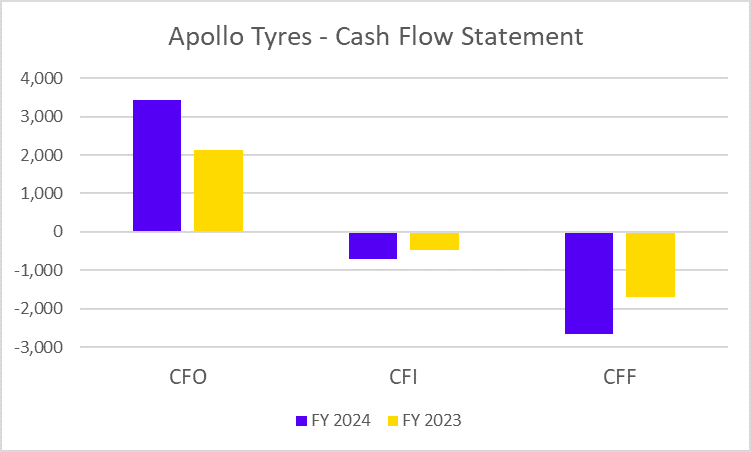
Apollo Tyres Cash Flow Statement
| Key Metrics | FY 2024 | FY 2023 |
|---|---|---|
| CFO | 3,439 | 2,134 |
| CFI | -710 | -476 |
| CFF | -2,659 | -1,691 |
JK Tyres
JK Tyre is another leading Indian tyre manufacturer. The company was not always a separate entity. It began as part of the J.K. Organisation, a diversified Indian conglomerate founded in 1918 by Lala Kamlapat Singhania. It became the first company to manufacture radial tyres in India.
J.K. Industries Limited, the parent company of JK Tyres, was restructured and in 2007, JK Tyres & Industries were created to concentrate more on the tyre business. They cater to a wide range of vehicles, including cars, motorcycles and off-road vehicles.
Additionally, with operations in key regions such as ASEAN, the Middle East and Africa as part of the APMEA region, the Company continued to invest in brand building, working on the requirements of each region to bring country-specific products.
JK Tyre has a strong distribution network in India that serves retail outlets, dealerships, and original equipment manufacturers (OEMs) of automobiles. This helps them keep a strong position in the local market.
The company’s manufacturing facility in Mexico serves the North American market and exports to over 100 countries worldwide. The global reach of the company enables them to access and explore untapped markets and exciting opportunities.
JK Tyre Consolidated Financial Statements
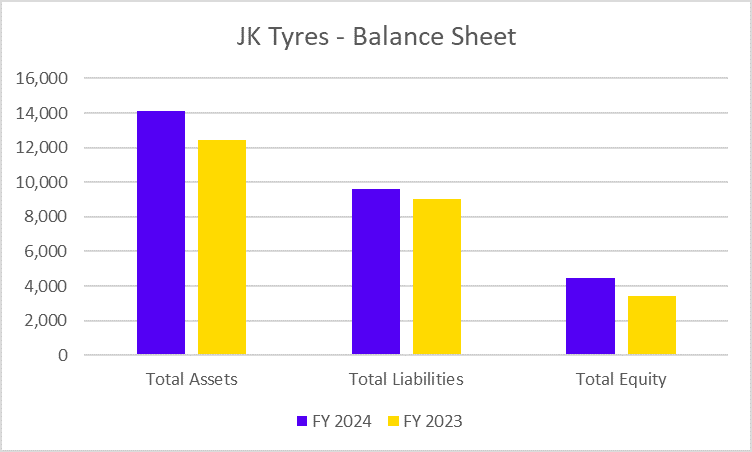
JK Tyre Balance Sheet
| Key Metrics | FY 2024 | FY 2023 |
|---|---|---|
| Total Assets | 14,094 | 12,448 |
| Total Liabilities | 9,606 | 9,051 |
| Total Equity | 4,488 | 3,395 |
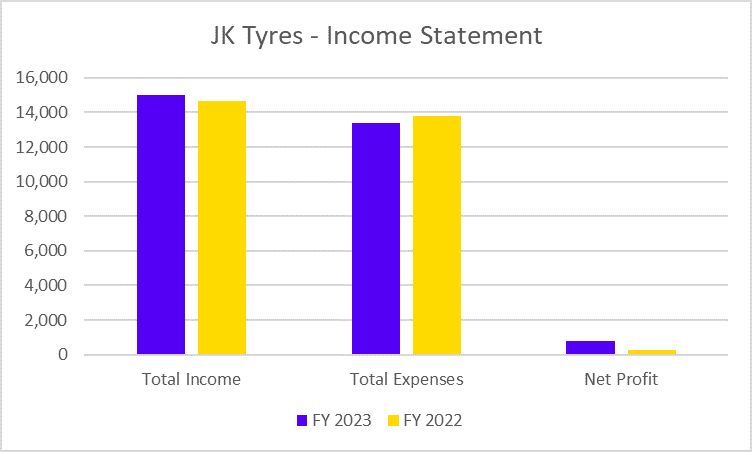
JK Tyre Income Statement
| Key Metrics | FY 2023 | FY 2022 |
|---|---|---|
| Total Income | 15,001 | 14,644 |
| Total Expenses | 13,388 | 13,815 |
| Net Profit | 811 | 264 |
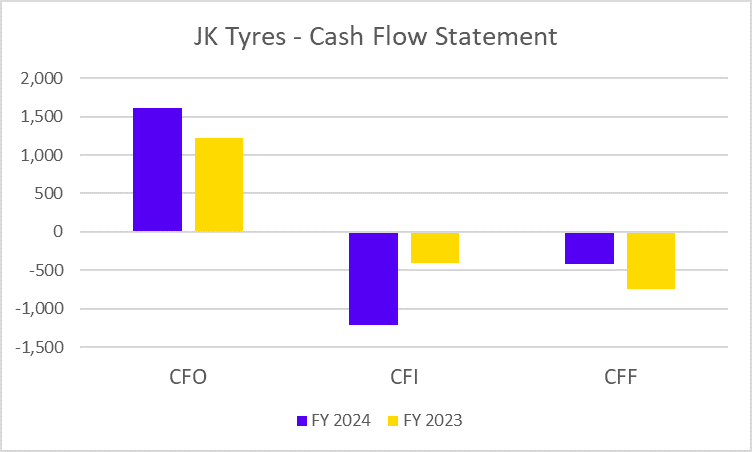
JK Tyre Cash Flow Statement
| Key Metrics | FY 2024 | FY 2023 |
|---|---|---|
| CFO | 1,614 | 1,224 |
| CFI | -1,208 | -400 |
| CFF | -413 | -747 |
CEAT
CEAT Limited, previously known as Cavi Electtrici e Affini Torino (Electrical Cables and Allied Products of Turin), is a leading and recognised multinational tyre manufacturing company headquartered in Mumbai, India. It was founded in 1924 in Turin, Italy, and then moved to India in 1958. The company is a flagship entity of the RPG Group, a prominent Indian conglomerate.
CEAT is more than just car tyres. They manufacture tyres for motorcycles, cars, trucks, buses, and other vehicles. The company has a global footprint spanning over 120 countries. Their tyres are trusted across various regions. It focuses on producing top-notch products and embracing innovation to meet the varied requirements of customers in different terrains and locations.
The company caters to a wider range of vehicles. They make tyres for a wide variety of vehicles, including motorcycles, cars, trucks, buses and other types of vehicles.
The company has a strong distribution network in India and abroad. It divided India into regions, and each Regional Distribution Centre (RDG) supplies tyres to Carrying Forward Agents or directly to dealers based on demand.
Carrying Forwarding Agents (CFA) act as intermediaries between RDCs and dealers ensuring efficient delivery of tyres to local retailers.
CEAT has over 4500 dealers and 51,000 sub-dealers in India, which makes their tyres widely available to consumers.
CEAT Consolidated Financial Statements
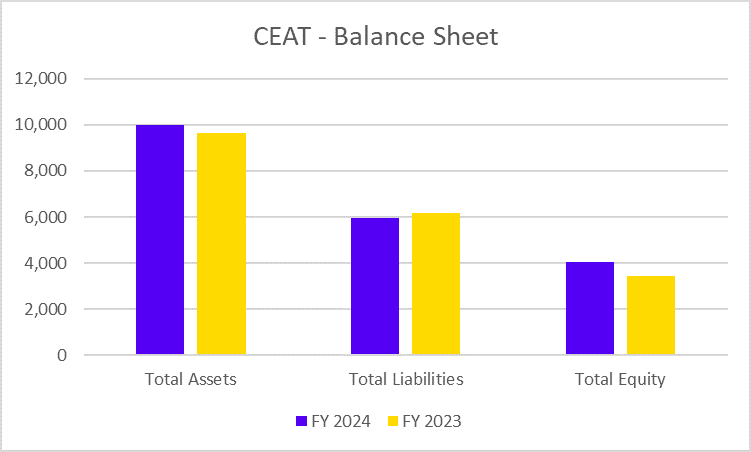
CEAT Balance Sheet
| Key Metrics | FY 2024 | FY 2023 |
|---|---|---|
| Total Assets | 9,994 | 9,627 |
| Total Liabilities | 5,951 | 6,187 |
| Total Equity | 4,042 | 3,439 |
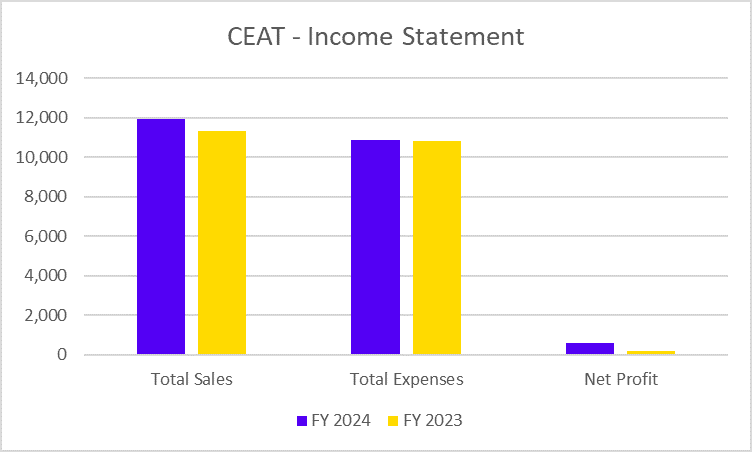
CEAT Income Statement
| Key Metrics | FY 2024 | FY 2023 |
|---|---|---|
| Total Sales | 11,943 | 11,314 |
| Total Expenses | 10,858 | 10,843 |
| Net Profit | 614 | 174 |
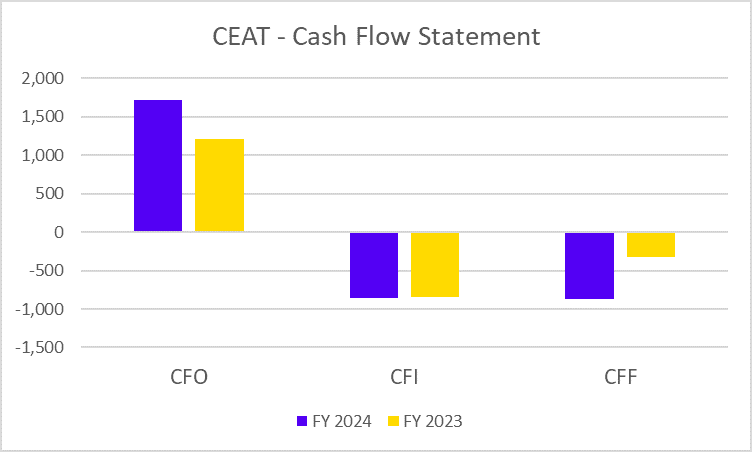
CEAT Cash Flow Statement
| Key Metrics | FY 2024 | FY 2023 |
|---|---|---|
| CFO | 1,719 | 1,205 |
| CFI | -853 | -849 |
| CFF | -871 | -319 |
Read Also: Top 10 Most Expensive Stocks in India
Tyre Stocks Comparative Analysis
Tyre Stocks Market Capitalisation (in INR crore)
| Company Name | Market Cap (in INR crore) |
|---|---|
| MRF | 55,561 |
| Balkrishna Industries | 62,060 |
| Apollo Tyre | 31,450 |
| JK Tyre | 10,263 |
| CEAT | 10,058 |
Tyre Stocks Current Market Price
| Company Name | CMP (in INR) |
|---|---|
| MRF | 1,26,145 |
| Balkrishna Industries | 3,210 |
| Apollo Tyre | 495 |
| JK Tyre | 394 |
| CEAT | 2,486 |
Tyre Stocks Price-to-Earnings Ratio
| Company Name | PE Ratio |
|---|---|
| MRF | 26.70 |
| Balkrishna Industries | 39.99 |
| Apollo Tyre | 17.24 |
| JK Tyre | 13.49 |
| CEAT | 15.65 |
Read Also: List of Best Chemical Stocks in India
Conclusion
The Indian tyre industry showcases a diverse range of companies, each with its unique strengths and specialities. MRF’s legacy and brand recognition, BKT’s focus on Off-Highway Tyres, and Apollo Tyre’s global presence constitute compelling options that cater to the diverse needs of the investors. JK Tyres dominates the trucks/bus Radial segment, while CEAT offers a comprehensive portfolio across various vehicle types. So which tyre stock suits you best? Consider your investment goals, risk tolerance and the specific market segment. The Indian Tyre industry is poised for growth due to rising vehicle production, incomes and infrastructure development. As these trends continue to unfold, the top tyre companies will probably take the lead by pioneering constant innovation and adapting to the ever-evolving needs of the market.
Frequently Asked Questions (FAQs)
What factors should I consider before choosing a tyre stock?
Legacy, product range, market presence, brand recognition and commitment to innovation should be considered before selecting a stock.
How are these tyre companies adapting for the future?
These companies are likely to continuously innovate and develop new technologies to fulfil the needs of the customers.
Should I invest in the above-discussed stocks?
Conduct your own research and due diligence before making any investment decisions.
Where can I find more information about these companies?
You can visit the company websites or search for industry reports and news articles.
Disclaimer
The securities, funds, and strategies discussed in this blog are provided for informational purposes only. They do not represent endorsements or recommendations. Investors should conduct their own research and seek professional advice before making any investment decisions.