| Type | Description | Contributor | Date |
|---|---|---|---|
| Post created | Pocketful Team | Oct-25-23 | |
| update FAQs Formatting | Nisha | Feb-24-25 |
Read Next![]()
- How to Store Gold Safely in India
- Mutual Funds vs Equity: Key Differences
- Rajesh Exports SEBI Case Explained
- How to Buy and Sell Bonds in India?
- Forex vs Stock Market: Key Differences
- What is a Best Currency ETFs in India
- Top 5 Optical Fibre Cable Stocks in India
- High Piotroski Score Stocks in India
- How to Invest in Copper ETF in India 2026
- Best Air Conditioners Stocks in India 2026
- Top Thorium Stocks in India 2026
- Top Uranium Stocks in India 2026
- PLI Scheme Beneficiary Stocks List 2026
- Top Large Cap Stocks With Highest DII Holding in India 2026
- Top Auto Ancillary Stocks in India 2026
- I’m 25 and Earning ₹30k a month. How Should I Start Investing for Long-Term Growth?
- How to Invest in S&P 500 from India
- How to Buy Silver ETF in India
- How Much Gold & Silver Should You Hold in Your Portfolio?
- Digital Silver vs Silver ETF: Which is Better?
Fibonacci Retracement: Complete Guide on How to Use and Strategy
Published on : 25th October 2023
|Updated on : 24th February 2025
The origin of the Fibonacci series can be traced back to the ancient Indian mathematic scripts. This series was first introduced by an Italian mathematician Leonardo of Pisa, who was also known as Fibonacci. He lived from the late 12th century to the 13th century. His seminal work, “Liber Abaci” (The Book of Calculation), which was published in 1202 helped him introduce the Fibonacci sequence to Europe. The Fibonacci sequence is a series of numbers in which each number is the sum of the two previous numbers, generally starting with 0 and 1. The Fibonacci series is a set of infinite numbers i.e., no matter how many numbers you add to the series, it never ends.

The Fibonacci series is as follows,
(0, 1, 1, 2, 3, 5, 8, 13, 21, 34, 55, 89, 144, 233, 377)
In the above set of numbers if you divide any number by the previous number; the ratio is always around 1.618. The Golden Ratio, approximately 1.618, also called Phi is a mathematical constant derived from the Fibonacci sequence. It has many applications in nature, art, and science. Our readers need to keep in mind that 0.618, when expressed in percentage is 61.8%. A number divided by the next highest number comes near to .6180
(13/21=.6190, 21/34=.6176, 34/55=.6181, 55/89=.6179). The estimate nears 0.6180 as the numbers increase. This forms the base for the 61.8% retracement. A number divided by another two places higher comes near to .3820
(13/34=.382, 21/55=.3818, 34/89=.3820, 55/=144=3819). This is the base for the 38.2% retracement
A number divided by another three places higher comes near to .2360
(13/55=.2363, 21/89=.2359, 34/144=.2361, 55/233=.2361).
What is Fibonacci Retracement?
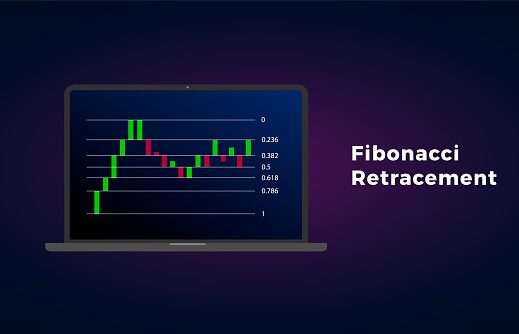
Fibonacci retracement is an indicator of technical analysis that is used in the stock market. The purpose of this tool is to recognize potential support and resistance levels in a candlestick chart of different financial assets. It is constructed on the Fibonacci sequence and the Golden Ratio, and it is a well-known indicator among traders and technical analysts.
Calculation Of Fibonacci Retracement
The commonly used retracement levels by analysts are 23.6%, 38.2%, 50.0%, 61.8%, and 76.4%.
Any trader needs to follow these steps to calculate the retracement levels of a particular stock.
Step 1. You need to identify a significant price move on your chart. This move can be either an uptrend or a downtrend. The starting point that a trader marks on the chart after applying the indicator should be a significant swing high or swing low.
Step 2. Determination of the Fibonacci Ratios
23.6% (0.236): we calculate this level by taking 23.6% of the pre-decided price range and adding it to the low point of an uptrend or subtracting it from the high point for a downtrend.
38.2% (0.382): To Calculate 38.2% of the price range the trader needs to follow the same addition or subtraction technique as above.
61.8% (0.618): To Calculate 61.8% of the price range use the same addition or subtraction method as above.
Other levels of the Fibonacci Retracements like 50% or 76.4% are also calculated similarly.
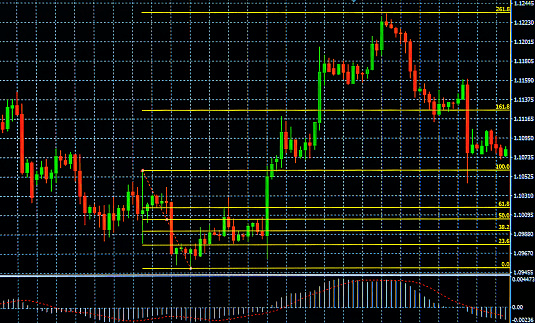
Step 3. Once you are done with the calculation of retracement levels start drawing horizontal lines at the calculated Fibonacci retracement levels. These lines represent the support and resistance levels for future price action that is expected to happen.
Now, start observing how the price of the asset reacts to these retracement levels. Any kind of bounce or reversal near these levels may provide buyers and sellers with some good trading opportunities.
Example of Fibonacci Retracement:
Let us understand Fibonacci Retracement with an easy and simplified example
Suppose you have identified a swing low of Rs.1000 and a swing high of Rs.1500 in an uptrend of a stock.
After determining these points, you need to calculate the price range by subtracting the swing low from the swing high
which implies that the price range will be (Rs.1500 – Rs. 1000) which equals Rs. 500
Having found the difference between the price ranges you can now calculate the retracement levels
Firstly, calculate 23.6% of the price range and add it to the swing low i.e., 23.6%*500=118+1000=1118
Then calculate 38.2% of the price range and add it to the swing low i.e., 38.2%*500=191+1000=1191
Now for the retracement level of 50%, divide the price range by 2 and add it to the swing low i.e., 500/2=250+1000=1250.
Similarly, calculate the 61.8% of the price range and add it to the swing low i.e., 61.8%*500=309+1000=1309
The values so derived (1118, 1191, 1250 and 1250) are the expected retracement levels.
Since we all know that Fibonacci retracement is a leading indicator as well as a widely used and famous tool in technical analysis applied by traders, it also has some advantages and limitations that traders should keep in mind before making any sort of trading decision.
Advantages of Fibonacci Retracement

Traders commonly value the following advantages of Fibonacci retracement
- Fibonacci retracement can be applied to various financial markets, including stocks, commodities, forex, and cryptocurrencies, on different timeframes like hourly, daily, weekly, and monthly, making it a multipurpose indicator for technical analysts.
- Traders use Fibonacci retracement in combination with other technical analysis tools, such as trendlines, moving averages, or oscillators. When different indicators give the same indication, like Fibonacci, chances are that the stock will move in the desired direction.
- Fibonacci retracement is used by traders to identify stop-loss orders range as per their risk levels.
- Fibonacci retracement can be used to identify potential profit targets. Traders often use the levels as reference points for setting profit targets.
- Fibonacci retracement is particularly useful for swing traders who often look for short- to medium-term price movements to earn from the stock market.
Disadvantages of Fibonacci Retracement

- Selecting the starting and ending points for the Fibonacci retracement analysis can be a tough task. It depends from trader to trader on what point they are choosing, which can eventually lead to varying retracement levels and trading decisions. This can lead to unnecessary confusion.
- Relying solely and completely on Fibonacci retracement may lead to false buy or sell signals or missed trading opportunities.
- Even though traders use this indicator widely, there is no assurance that the price will precisely bounce at the estimated Fibonacci retracement levels.
- Fibonacci retracement may be difficult for beginner traders to understand since it might be confusing for them to choose the swing high or swing low.
- Different timeframes can yield different retracement levels. Traders may face variations in levels on daily, weekly, or intraday charts.
Relation between Fibonacci Series and Fibonacci Retracement
The Fibonacci series and the numbers derived from it, such as the Golden Ratio (1.618), are used in the construction of Fibonacci retracement levels.
The important retracement levels in Fibonacci retracement are ratios that are derived from the Fibonacci series. For example, the 61.8% retracement level corresponds to the inverse of the Golden Ratio (1/1.618).
Fibonacci retracement is a real-world application of the Fibonacci series in technical analysis. Traders use the Fibonacci series and its ratios to find levels of support and resistance in financial markets for making sound trading decisions.
Read Also: 5 Must-Read Best Swing Trading Books for Trader
Conclusion

Remember that the effectiveness of Fibonacci retracement levels varies, and they should be used in combination with other technical analysis indicators and risk management strategies to make informed trading decisions. Additionally, the choice of starting and ending points can be somewhat subjective, so practice and experience are essential when applying Fibonacci retracement in real trading sessions.
FAQs (Frequently Asked Questions)
01
Which are the most popular Fibonacci retracement levels?
The most popular Fibonacci levels are 0.236, 0.382, 0.618.
02
Is Fibonacci a leading or lagging indicator?
Fibonacci is a leading indicator.
03
Can I use Fibonacci in intraday trades?
Yes, Fibonacci can be used on various timeframes including intraday.
04
Who discovered the Fibonacci series?
Leonardo Pisano discovered the Fibonacci series in the 12th century.
05
What is the Fibonacci Series?
The Fibonacci sequence is a series of numbers in which each number is the sum of the two preceding ones, typically starting with 0 and 1.
Disclaimer
The information shared in this content is intended solely for educational and informational purposes and should not be considered financial, investment, or trading advice. Any references to stocks, mutual funds, or market instruments are purely for informational purposes and do not constitute recommendations. Investments in financial markets are subject to market risks, and past performance is not indicative of future returns. Readers are advised to conduct independent research, review official documents carefully, and consult a qualified financial advisor before making any investment or trading decisions.