| Type | Description | Contributor | Date |
|---|---|---|---|
| Post created | Pocketful Team | Jan-29-24 |

- Blog
- hdfc vs sbi comparative analysis of banking stocks
HDFC vs SBI? Comparative Analysis Of Banking Stocks

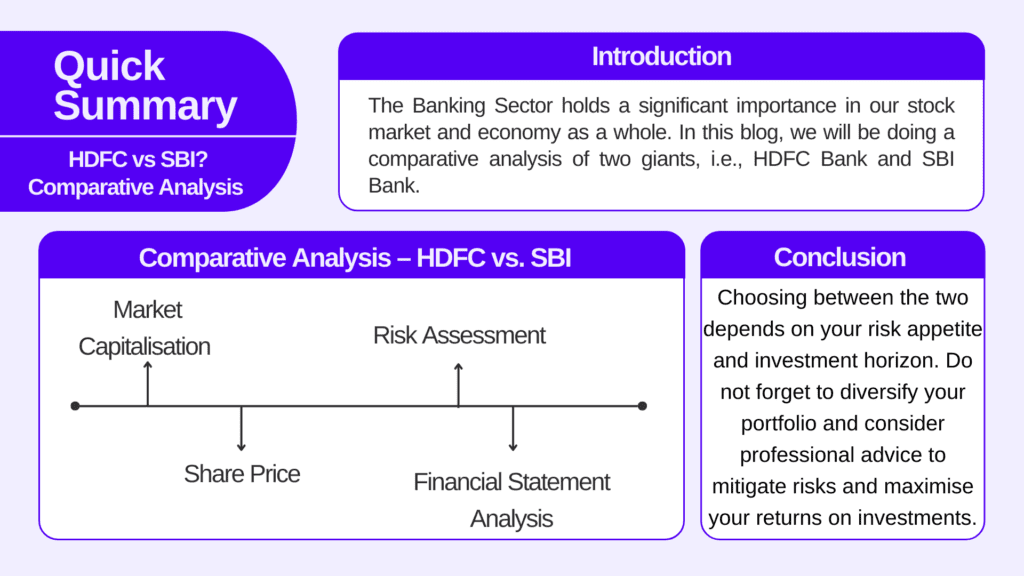
The Banking Sector holds a significant importance in our stock market and economy as a whole. In this blog, we will be doing a comparative analysis of two giants, i.e., HDFC Bank and SBI Bank.

HDFC Bank
HDFC Bank (Housing Development Finance Corporation ) is a leading private sector bank and was incorporated in August 1994 by HT Parekh. It started its operations as a scheduled commercial bank in January 1995.
The bank provides a wide range of financial products and services, such as retail banking, wholesale banking etc. and offers services like loans, credit cards, savings accounts, current accounts, investment products, etc.
As of December 2023, the Bank held 8,086 branches and 20,668 ATMs across 3,836 cities with its headquarters in Mumbai. HDFC Bank has branches in four countries and three representative offices in Dubai, London & Singapore that offer home loan products to NRI citizens and persons of Indian origin. HDFC Bank is listed on the BSE and NSE with the symbol HDFCBANK.
The Bank’s philosophy is based on five core values: Operational Excellence, Customer Focus, Product Leadership, People, and Sustainability.
Read Also: HDFC Bank vs Axis Bank
State Bank of India
SBI is the largest public sector bank in India and is a titan in the Indian banking landscape with a 1/4th share in the market. SBI is headquartered in Mumbai and holds a rich heritage of over 200 years.
The roots of SBI trace back to 1806 with the establishment of the Bank of Calcutta, the first joint stock bank in British India. Three separate presidency banks – Bank of Bengal, Bank of Bombay, and Bank of Madras emerged across British India. In the year 1921, the three presidential banks merged to form the Imperial Bank of India.
In the year 1955, the government of India nationalised the Imperial Bank of India and renamed it as State Bank of India. SBI later acquired various state-associated banks and commercial banks.
SBI has played an important role in bringing banking services to rural areas. Currently, SBI holds a strong distribution network of 22,405 branches and 65,627 ATMs.
Read Also: SBI vs ICICI Bank
Comparative Analysis – HDFC vs. SBI
Dive into the ultimate SBI and HDFC comparison to explore their market strengths, financial ratios, and growth strategies, helping you make an informed choice between India’s top banking giants.

Choosing between HDFC Bank and SBI Bank is a tough task since both are the leading Indian banks, and each has its strengths. The points mentioned below will give you an overview of them (As of 29 Jan 2024):
Market Capitalisation
HDFC Bank – INR 11,04,388 crore
SBI – INR 5,55,823 crore
According to the data by NSE, the weightage of HDFC bank is comparatively more than SBI Bank in indices such as NIFTY and NIFTY Bank.
Share Price
HDFC Bank – INR 1455
SBI – INR 623
Both banks have their separate growth strategies, but HDFC Bank’s focus on digital adoption might give them an edge in the long run.
Risk Assessment
Analysing key financial ratios can provide valuable insights into the relative risk profiles of HDFC and SBI Bank. Let’s have a glimpse at how the ratios of both banks look like:
| Ratio | HDFC | SBI |
| Net Interest Margin (NIM) | 3.65% | 2.38% |
| Debt-to-Equity Ratio | 16.79% | 13.01% |
| Non-Performing Assets (NPA) | 0.76% | 2.78% |
| Return on Equity (ROE) | 15.17% | 5.03% |
| Returns on Capital Employed (ROCE) | 3.10% | 1.74% |
| PE Ratio | 19.48x | 8.40x |
For your reference, the ratios given in the table are explained below:
- Net Interest Margin (NIM) – NIM is an important metric for banks since it drives profitability. A higher NIM depicts that a bank can generate more revenue from lending than paying out interest on borrowings. We can say that a high NIM is a sign of a profitable bank.
- Debt-to-Equity Ratio – D/E ratio measures how much debt a company is using to finance its assets. A high D/E ratio shows that the company’s major funding comes from debt.
- Non-Performing Asset (NPA) – NPA is defined as loans and advances on which interest or principal payment is overdue. Low NPAs show effective credit risk management.
- Return on Equity (ROE) – ROE measures the profitability of the company generated from the shareholder’s equity.
- Returns on Capital Employed (ROCE) – ROCE measures the profitability of the company from total capital (equity and debt) employed by the company.
- PE Ratio – The PE ratio measures the price paid by the investor relative to per share of earnings.
From the above ratios, we can interpret that:
- HDFC Bank shows an overall lower risk profile when compared to SBI. On the other hand, SBI benefits from lower leverage and is trading at a cheaper price than HDFC Bank.
- SBI vs HDFC profit comparison reveals that both banks have shown robust growth, but their strategies and performance metrics differ significantly.
- Further, HDFC Bank has lower NPAs, which showcases better asset quality and lower credit risk compared to SBI.
- SBI displays a lower reliance on debt. However, HDFC Bank has delivered significantly higher returns on equity that reflect investor’s interest and value creation.
Financial Statement Analysis

Below mentioned points below will help you with an in-depth analysis of the financial statements of both banks:
- Net Profit – HDFC Bank holds an edge with a higher net profit of INR 17,718 crore, whereas SBI’s net profit stood at 16,383 crore.
- Revenue – Both the stocks have shown robust growth with HDFC Bank’s revenue standing at INR 115,015 crores, whereas SBI’s revenue stood at INR 144,256 crores.
- Total Assets – SBI possesses total assets of INR 5,954,418 crore whereas HDFC Bank INR 2,530,432 crore.
- Total Liabilities – SBI exhibits a slightly higher level of borrowings, i.e., INR 5,954,418 crores, compared to HDFC Bank 2,530,432. This could be due to SBI’s broader operations.
- Investments – SBI holds a larger proportion of investments with INR 1,913,107 crore as compared to HDFC Bank’s investment of INR 511,581 crores.
- Loans and Advances – Both the banks allocate a significant portion of their total assets to loans, with HDFC Bank having a bit less concentration at INR 1,661,949 crores as compared to SBI Bank, which stood at INR 3,267,902 crores.
*All the figures mentioned above are as of the September 2023 quarter.
Conclusion
Predicting the long-term outlook for any company is inherently a tough task and is uncertain because the long-term perspective is subject to change based on unforeseen factors. However, both banks will benefit from the projected growth of the economy, and since SBI is a public sector bank, it is likely that it may benefit from government initiatives focused on financial inclusion and infrastructure development. Not only this, but also both banks need to manage credit risk and NPAs effectively to ensure sustainable growth.
Last but not least, choosing between the two depends on your risk appetite and investment horizon. Do not forget to diversify your portfolio and consider professional advice to mitigate risks and maximise your returns on investments.
| S.NO. | Check Out These Interesting Posts You Might Enjoy! |
|---|---|
| 1 | ICICI Vs HDFC Bank |
| 2 | Axis Bank vs ICICI Bank |
| 3 | PNB vs SBI |
| 4 | Bank of Baroda vs SBI |
| 5 | PNB vs Bank of Baroda |
Frequently Asked Questions (FAQs)
When was HDFC Bank founded?
HDFC Bank was founded in August 1994.
When was SBI founded?
SBI was founded in the year 1921.
Who was the founder of HDFC?
HT Parekh
Which bank has lower NPAs?
HDFC Bank.
What was SBI called earlier?
Imperial Bank of India
Disclaimer
The securities, funds, and strategies discussed in this blog are provided for informational purposes only. They do not represent endorsements or recommendations. Investors should conduct their own research and seek professional advice before making any investment decisions.