| Type | Description | Contributor | Date |
|---|---|---|---|
| Post created | Pocketful Team | Sep-07-23 | |
| Add new links | Nisha | Feb-25-25 |

- Blog
- how to use technical analysis on charts
How to use technical analysis on charts

If you are active in the stock market, you must have heard the term technical analysis quite often. Technical analysis is analysing the market movement and catching the trend. Technical analysis is used for short-term trading or investment. Wherein you gain by capturing the small price difference within a short period.

What is technical analysis?
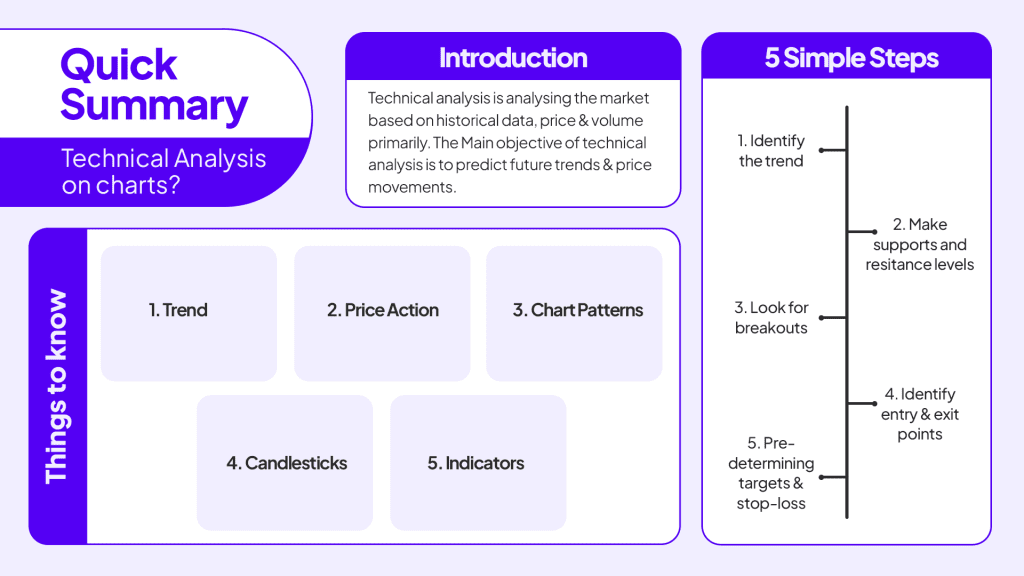
Technical analysis is analysing the market based on historical data, price & volume primarily. The Main objective of technical analysis is to predict future trends & price movements. This objective goes against the past established theories. Like never trying to predict the markets, focusing on the long term, doing fundamental analysis and more, because for all these reasons Relevance of technical analysis gets questioned.

Technical analysis follows the ideology of history repeating itself. Following this principle, various techniques have been developed over the years. Like trading using price action, indicators, chart patterns and more. Patterns get identified using the past historical data of the companies and the indices present. To draw inferences for making the entry-exit decisions in a trade.
Read Also: Best Options Trading Chart Patterns
How to do technical analysis?
There are a few things you should understand before starting to do a technical analysis which are:
1. Trend:
The direction in which the market moves is called a trend. In the stock market Trends can be of three types. Upward, Downward and Sideways. Let’s understand each one of them:

- Upward trend-
The market is in an upward trend when it keeps making new higher highs. And when the market is in an upward trend we say that the market is bullish. - Downward trend-
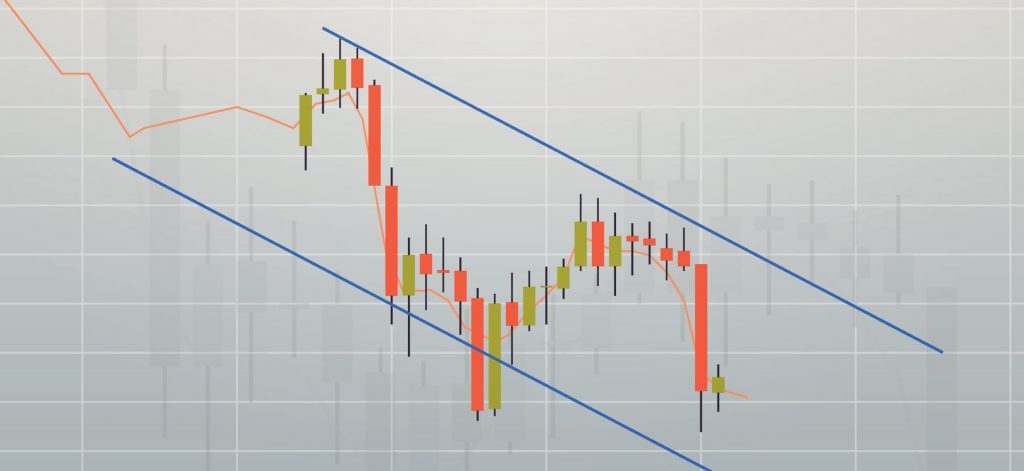
The market is in a downward trend when it keeps making lower lows. When the market is in a downward trend and keeps falling we call it a bearish sentiment.
- Sideways trend–
When the market moves in a fixed range for some duration it is said to be sideways. We often say that the market is consolidating when it moves like this.
2. Price action:
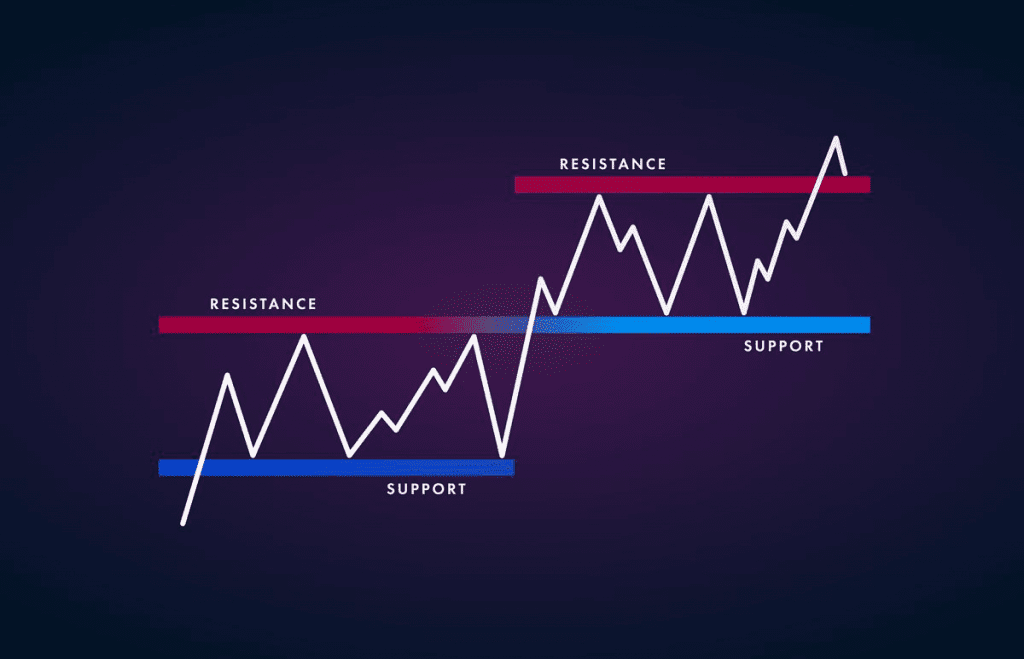
If you are active in the Stock Market you must have heard the term Price Action. So Price Action is the process of analysing the price movement of a security or asset and determining potential entry and exit points for a trade. While trading with Price Action, the main task is correctly identifying the support and resistance levels on the chart.

Let’s briefly understand what support and resistance levels are:
- Support –
Support is that level on the chart from where the price is likely to increase or reverse its trend. Support shows the minimum willingness of the buyers to buy the security. To make a support line on a chart you look for a common point from where the price is bouncing back. Support levels on the chart help to identify breakouts. - Resistance-
Resistance is the price level zone on the chart from where the price is likely to decrease or change its trend. Mark the points on the chart, from where the price is reversing. This way, You will see the resistance levels on the chart.
3. Chart patterns:
Chart patterns are the Figures and patterns that form on the chart of an asset. These patterns have been developed over a while, using historical data from the past 100 years. Chart patterns show or predict the price movements considering how the price has redacted in the past. Broadly chart patterns fall into three main categories that are listed below:

- A continuous pattern indicates that a trend will continue for some time.
- A reversal pattern indicates that the price may change its movement & there will be a price reversal.
- A bilateral pattern may show that the market is highly volatile & the price could go either way.
4. Candlesticks:
Candlesticks are a type of price chart used in technical analysis. It is the most popular type of charts used by traders. It shows the High, Low, Open and Close prices.

- A green candlestick depicts that the price is moving in an upward direction. The wick shows the maximum price level it had touched in that period. The upper part of the green body shows the closing. The lower part of the green body shows the opening of the price.
- A red candlestick depicts that the price is moving in a downward direction. The wick shows the highs and lows it had made. The upper body part of the red candle indicates the price opening & the lower body part shows the closing price.
5. Indicators:
Indicators in the stock market are mathematical tools developed using advanced algorithms and historical data to predict price movements. Different charting platforms provide their users with several indicators to use. Some famous indicators are listed below:

- RSI (Relative Strenght Index):
RSI is one of the most popular indicators among traders. It helps in identifying the overbought and oversold stocks. After reaching a saturation point potential exits and entries are forming in the trade. - MACD (Moving average divergence Convergence):
MACD was developed by ‘Gerald Appel’ in the late 1970s. It was designed to reveal changes in the strength, direction, momentum, and duration of a trend in a stock’s price. - VWAP ( Volume Weighted Average Price):
Vwap is a technical indicator that indicates the price movement based on the volume of the security. Volume is the total buying and selling of the financial asset. In case of high buying volume, the price falls. On the other hand higher buying volume, the price increases.
After understanding all these terms like Trend, Price Action, Indicators, and Chart patterns, it depends on the personal preference of the trader and which tools they use for technical analysis.
Five simple steps of technical analysis for any beginner or a seasoned trader
1. Identify the trend:
The first thing in doing technical analysis is to identify the trend in the market. You can use trendlines to identify the Trend. To draw a Trendline join the higher highs or, the lower lows of the candles. Another way of identifying the trend in the market is by using indicators. Many indicators help to capture the Trend. Analyse if the market is in a downtrend. Up trend or sideways.
2. Make support and resistance levels:
After identifying the Trend in the market, make support and resistance levels. Look for the points from where the price is reversing its movement. Again, you can identify the support and resistance level by yourself or with indicators.
3. Look for breakouts:
A breakout indicates a trend movement in the price after breaking the support or the resistance levels. For example, if the resistance breaks, the price may move in a bullish trend for some time. However, if the support breaks, the price may move in a Downward Trend.
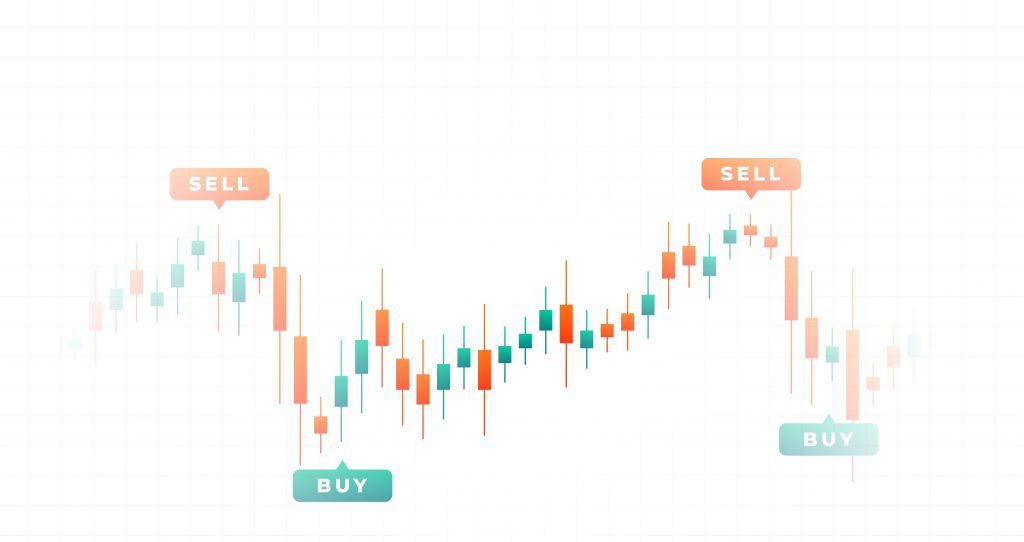
4. Identify entry and exit points:
After identifying a Breakout it’s important to determine your entry & exit prices. Sometimes, the markets are so volatile that you can’t get an entry in the trade at the desired price. In that case, you should not run after the Trade but look for another entry.
5. Pre-determining targets and stop loss:
The last and most crucial step is to pre-define your targets and stop loss even before entering the trade. When you enter a Trade & it’s going in your desired direction. It makes you overwhelmed and without a definitive target. You keep on trailing the trade and end up making a loss.
Read Also: Chart Patterns All Traders Should Know
Conclusion
Thus, summarising the above read, we can conclude that Technical Analysis is also an important branch of investing. It helps us to invest and trade in the market in the short-term and medium-term. Doing technical analysis requires precision, perseverance and practice. While investing or trading one must keep their emotions under control to be successful in the market.
FAQs (Frequently Asked Questions)
- What is technical analysis in the stock market?
Technical analysis in the stock market is the process of identifying the trends and predicting the price direction.
- What are the best books for technical analysis?
There are so many good books in the market for technical analysis. Example Encyclopedia of Chart Patterns, Technical Analysis of the Financial Markets: and many more. - What is the difference between fundamental analysis and technical analysis?
Fundamental analysis assesses the financial health of the company. Technical analysis analyses the share price movement.
- What is the Dow Theory of technical analysis?
Dow’s theory was taken from the editorials of Charles H. Dow. According to this theory, a shift in the bullish or bearish trend is confirmed by multiple indices.
Disclaimer
The securities, funds, and strategies discussed in this blog are provided for informational purposes only. They do not represent endorsements or recommendations. Investors should conduct their own research and seek professional advice before making any investment decisions.