
| Type | Description | Contributor | Date |
|---|---|---|---|
| Post created | Pocketful Team | Mar-06-24 | |
| Add new links | Nisha | Feb-25-25 |
Read Next![]()
- MCX Trading: What is it? MCX Meaning, Features & More
- Top 10 Intraday Trading Strategies & Tips for Beginners
- How to Use Pivot Points in Intraday Trading?
- What is Intraday Trading?
- Understanding Intraday Trading Timings
- How to Choose Stocks for Intraday the Right Way?
- Blending Candlestick Patterns: How It Works, Benefits & Drawbacks
- Market Order Vs Limit Order: What’s the Difference?
- Silver Futures Trading – Meaning, Benefits and Risks
- What is Crude Oil Trading and How Does it Work?
- Top Algorithmic Trading Strategies of 2025
- What is Paper Gold? – Meaning, Types, & Benefits
- What is Algo Trading?
- What is Tick Trading? Meaning & How Does it Work?
- Rising Window Candlestick Pattern
- Black Candle Pattern
- Piercing Pattern
- High-Wave Candlestick Chart Pattern
- Closing Black Marubozu Candle
- What is the Best Time Frame for Swing Trading?

- Blog
- introduction to bearish candlesticks patterns implications and price movement prediction
Introduction to Bearish Candlesticks Patterns: Implications and Price Movement Prediction
|
|
In our last blog, we explained a candlestick pattern and which bullish patterns to consider before entering a bullish trend. However, how can you tell when a stock will correct after making higher highs? In this blog, we’ll introduce you to several bearish candlestick patterns, which will help you determine when to exit a buying position.
To learn more about bullish candlestick patterns, click here.
Hanging Man
Typically, this one-off candlestick pattern emerges after an upward trend. It is referred to as a bearish reversal pattern, which suggests that an uptrend is ending and that a stock price correction is on the card. The candle is small in the top part and has a lengthy bottom shadow that extends beyond the body of the light, giving the appearance of a hanging man. However, the shadows in the upper part are either nonexistent or minimal. This pattern appears after a strong uptrend with an increase in selling volume.
Shooting Star
The shooting star sometimes called the inverted hammer candlestick pattern, signals that a stock’s upward trend will halt and a negative one is about to start. The single candlestick in this pattern has a little body with a longer upper shadow (lacks a lower shadow). This candle typically indicates that although purchasers attempted to drive up the price, they could not because of selling pressure.
Dark Cloud Cover
A pair of candlestick patterns called “dark cloud cover” signals the end of an uptrend. A bullish candle with a lengthy white or green body that suggests a significant upward trend will be the first candle to appear. The second candle will be red and open higher than the close of the day before, but it closes below the candle’s halfway. This pattern typically signals a bearish trend’s beginning and a bullish sentiment’s end.
Bearish Engulfing
It is considered a strong reversal signal, which indicates that bullish movement is about to end, and a potential downtrend may start. This is also a two-candlestick pattern out of which the first candle is green and has a small body. The second candle opens above the previous day’s close and closes below the last day’s open by covering the entire range of the last day’s candle. The size of the second candle needs to be larger than the size of the first candle.
Three Black Crows
The three candlestick pattern known as the “three black crows” is a vital clue that a negative trend in the script is about to start. The three candles are all bearish, and since their closing prices are all less than their opening prices, they are likely to lack a wick or have a short one. The selling pressure increases with the length of the candle’s body. And the closing price of every candle should be near to its low. Also, a larger volume using these candles will put more pressure on the seller to sell.
Tweezer Top
This pattern suggests that the peak has formed and that the stock is ready to go into a bear trend. This is also a two-candlestick pattern, where the buyers are showing interest in the stock indicated by the first green candle, and the second candle, which forms later, is bearish, indicating that the closing price is lower than the opening price and that the highs of both candles are the same or barely differ. This pattern suggests that selling pressure is building and that purchasers are unable to gain control over the stock. These two candles are known as “Tweezer Tops” because of the way their patterns form; they look like tweezers.
Gravestone Doji
At the height of a bullish run, this candlestick pattern emerges. The graveyard doji is a little real-body candle with a long upper wick or shadow and a small or nonexistent below shadow. It shows that the opening and closing values of the candle are near the low of the trading session. The shape suggests that the buyer initially attempted, but was unable, to drive the price higher, and that ultimately, the closing price approached the lowest price of the day, taking the form of a gravestone.
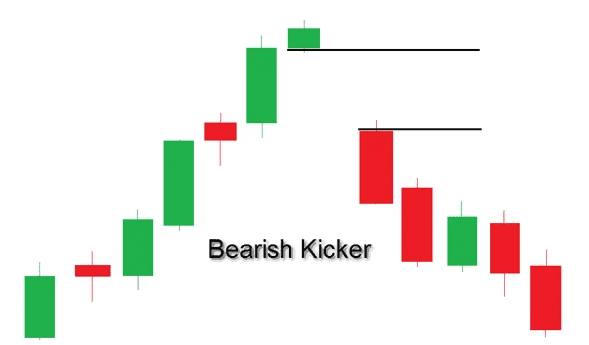
Bearish Kicker
The pressure of volume has suddenly shifted from purchasing to selling. This two-candlestick pattern usually appears near the peak of an ascending trend. Two candlesticks will appear in this pattern: a long, bullish candle that suggests the upswing will continue and a gap-down candle that opens below the closing price of the preceding candle and closes below its low.
Bearish Harami
Bearish harami is a pattern that generally indicates that the upside has now been limited in stock, and a downside movement looms. It is a two-candlestick pattern. The first candle is a large bullish candle, followed by the second bearish candle, which is very small in trend and engulfed by the previous candle. The closing price of the second candle is significantly lower than the opening price of the first candle.
Read Also: Introduction to Bullish Candlestick Patterns: Implications and Price Movement Prediction
Conclusion
The bearish candlestick patterns will assist traders in taking short positions in the market. Using the indications above, one may determine when a bullish trend in a specific stock is about to stop and a negative trend is about to start. In general, there is no assurance from these indicators that the bearish trend will begin or persist. It is essential to realize that these patterns may not hold up if any unexpected news regarding the stock is made public.
Thus, before making any trades, traders should always review the larger market context, consider a few more indications in addition to the ones listed above, and remember that risk management is crucial.
Frequently Asked Questions (FAQs)
How important are the length and shape of a bearish candlestick pattern??
The length and shape of the candlestick pattern typically indicate the level of selling pressure in a particular stock.
Where can the bearish candlestick pattern be found?
A bearish candlestick pattern can be discovered close to the resistance level in an uptrend.
When a stock is trending downward, can I still trade?
Yes, you can take advantage of the sell-side opportunity by initiating a short position in the stock.
Which bearish candlestick pattern is the most effective?
There are various bearish candlestick patterns, such as bearish harami, hanging man, shooting star, black cloud cover, etc. However, each bearish candlestick pattern has pros and cons, so managing your risk appropriately is vital.
Is it possible for me to trade without understanding candlestick patterns?
You can trade without knowing about candlestick patterns. Still, it could be quite challenging for you to determine any stock’s trend because candlestick patterns are used in technical research to help you determine potential stock price trends.
Disclaimer
The securities, funds, and strategies discussed in this blog are provided for informational purposes only. They do not represent endorsements or recommendations. Investors should conduct their own research and seek professional advice before making any investment decisions.