
| Type | Description | Contributor | Date |
|---|---|---|---|
| Post created | Pocketful Team | Nov-22-23 | |
| Add new links | Nisha | Mar-01-25 |
Read Next![]()
- MCX Trading: What is it? MCX Meaning, Features & More
- Top 10 Intraday Trading Strategies & Tips for Beginners
- How to Use Pivot Points in Intraday Trading?
- What is Intraday Trading?
- Understanding Intraday Trading Timings
- How to Choose Stocks for Intraday the Right Way?
- Blending Candlestick Patterns: How It Works, Benefits & Drawbacks
- Market Order Vs Limit Order: What’s the Difference?
- Silver Futures Trading – Meaning, Benefits and Risks
- What is Crude Oil Trading and How Does it Work?
- Top Algorithmic Trading Strategies of 2025
- What is Paper Gold? – Meaning, Types, & Benefits
- What is Algo Trading?
- What is Tick Trading? Meaning & How Does it Work?
- Rising Window Candlestick Pattern
- Black Candle Pattern
- Piercing Pattern
- High-Wave Candlestick Chart Pattern
- Closing Black Marubozu Candle
- What is the Best Time Frame for Swing Trading?

- Blog
- option chain analysis a detail guide for beginners
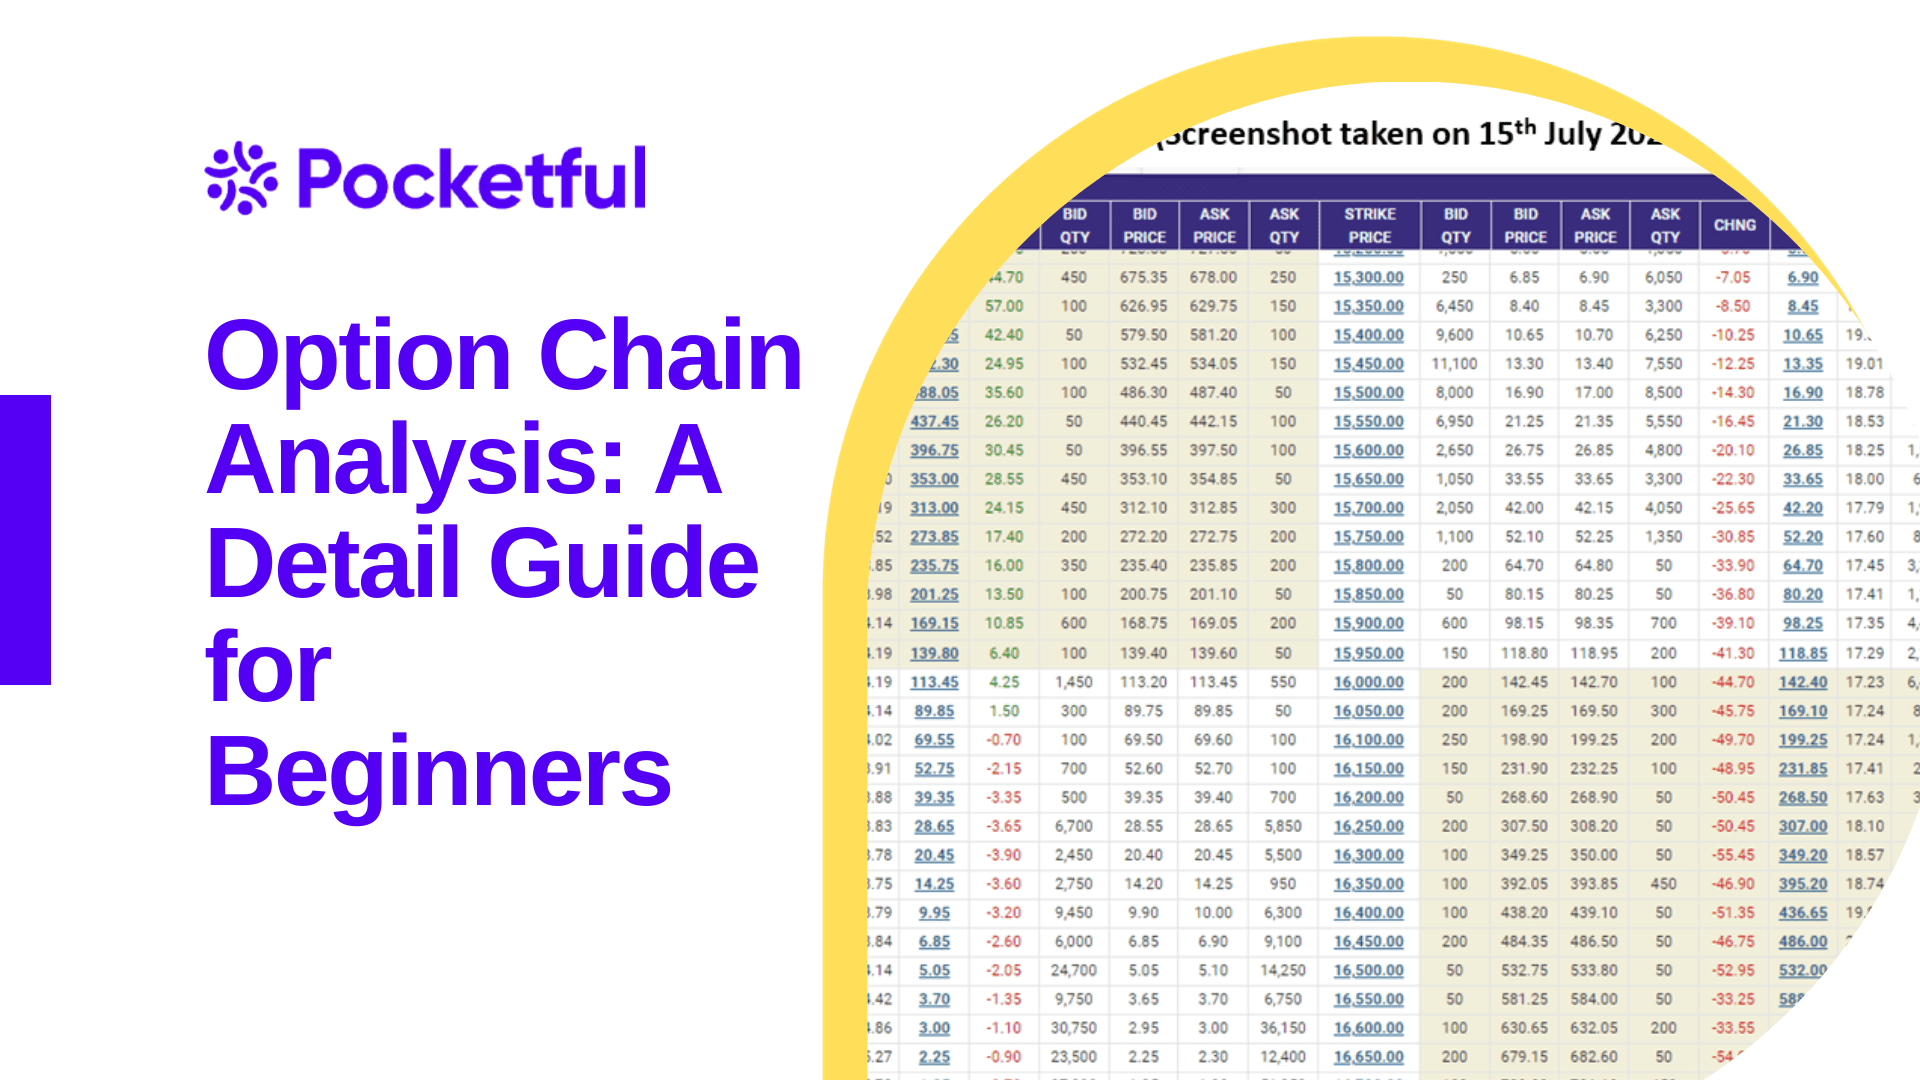
Option Chain Analysis: A Detail Guide for Beginners
|
|
What are the Options?
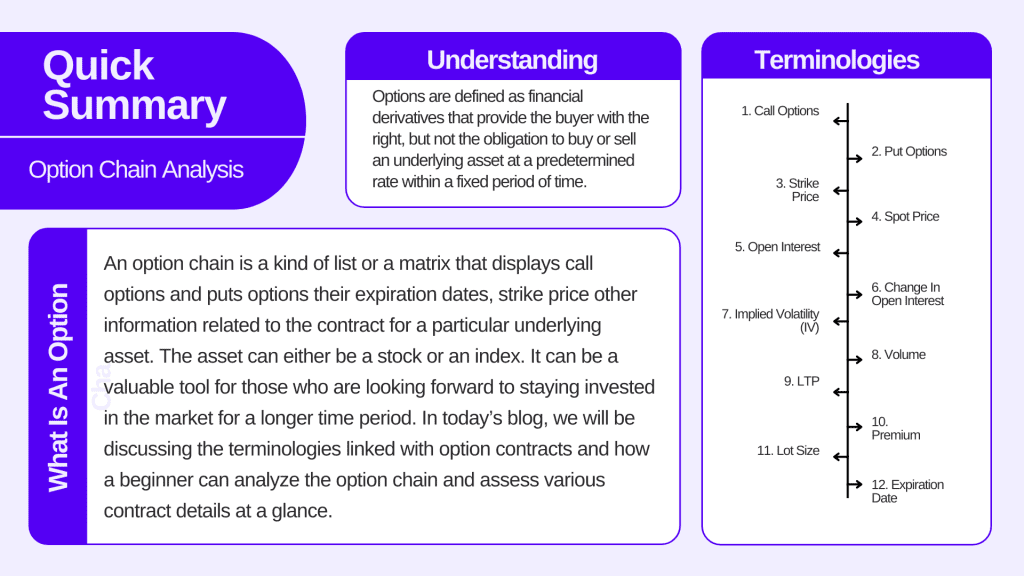
Options are defined as financial derivatives that provide the buyer with the right, but not the obligation to buy or sell an underlying asset at a predetermined rate within a fixed period of time. Options Trading involves a contract between buyer and seller. These underlying assets include stocks, commodities, indices, or currencies. There are various strategies to trade options. Some of the widely used strategies include straddle, strangle, butterfly spread, covered call, etc. which we will discuss later. Options can be used for speculation, hedging, and generating income.

What is an option Chain?
An option chain is a kind of list or a matrix that displays call options and puts options their expiration dates, strike price other information related to the contract for a particular underlying asset. The asset can either be a stock or an index. It can be a valuable tool for those who are looking forward to staying invested in the market for a longer time period. In today’s blog, we will be discussing the terminologies linked with option contracts and how a beginner can analyze the option chain and assess various contract details at a glance.
Read Also: What is Implied Volatility in Options Trading
Terminologies linked with option chain
1. Call options
Options may be categorized into Call options and put options. Call options are contracts that give the holder the right to buy the underlying asset at a particular strike price before or on the date of expiry.
2. Put options
Contracts give the holder the right to sell an underlying asset at a fixed price before or on the date of expiry.
3. Strike Price
It is the price per share for which the underlying security may be purchased by the call option holder (or sold by the put option holder)
4. Spot price
It is the price at which the underlying asset is trading in the spot market.
5. Open Interest
Open interest is the total number of options contracts outstanding for an underlying asset.
6. Change in open interest
Change in OI is the number of contracts that are closed, open, or squared off.
7. Implied Volatility (IV)
It is a measure of the market’s expectation of future volatility in stock prices.
8. Volume
Volume represents the total number of option contracts traded for a particular strike price and expiry date.
9. LTP
LTP is the last traded price of an option.
10. Premium
It is the price that an investor pays to buy an option contract. The premium of the contract is influenced by various factors including the strike price, volatility, expiry date and market sentiment.
11. Lot Size
Lot size or contract size is the number of units of underlying assets in a contract. For example, the lot size of the Nifty option is currently fixed at 50.
12. Expiration Date
The day on which a derivative contract ceases to exist is known as the expiration date. Option contracts expire on the last Thursday of the month.
13. In-the-money (ITM) option
A call option is said to be in ITM when the spot price is higher than the strike price. A put option is said to be in the ITM when the spot price is lower than the strike price.
14. At-the-money (ATM) option
This leads to zero cash flow if exercised immediately, and for this option both call and put, the strike price is equal to the spot price.
15. Out-of-the-money (OTM) option
This leads to negative cash flows if exercised immediately. A call option is said to be in the OTM when the spot price is lower than the strike price and a put option is said to be in the OTM when the spot price is higher than the strike price.
16. Intrinsic value and Time value of an option
The intrinsic value of an option refers to the amount an option buyer will realize, before adjusting for the premium paid. Only in-the-money (ITM) options have intrinsic value whereas at-the-money and out-of-the-money options have zero intrinsic value. The intrinsic value of an option can never be negative.
Intrinsic value = current stock price – strike price
Time value is the difference between the premium and intrinsic value. ATM & OTM options have only time value because their intrinsic value is zero.
17. Bid & Ask Prices
A bid is the price a buyer is willing to pay and ask is the price sellers are asking for an option.
18. Option Greeks
Option premiums change with changes in the factors that decide the price of the option i.e., factors such as strike price, volatility, etc. The sensitivities captured in the market are collectively known as Greeks represented by Delta, Gamma, Theta, Vega, and Rho.
- Delta – It measures the sensitivity of the option value to a given small change in the price of the underlying asset.
- Gamma– it measures the change in delta with respect to the change in price of the underlying asset. It signifies the speed at which an option will go either in-the-money or out-of-the-money.
- Theta– This measures an option’s sensitivity to time decay.
- Vega- this measures the sensitivity of an option to changes in the volatility of the market.
Analysis of option chain
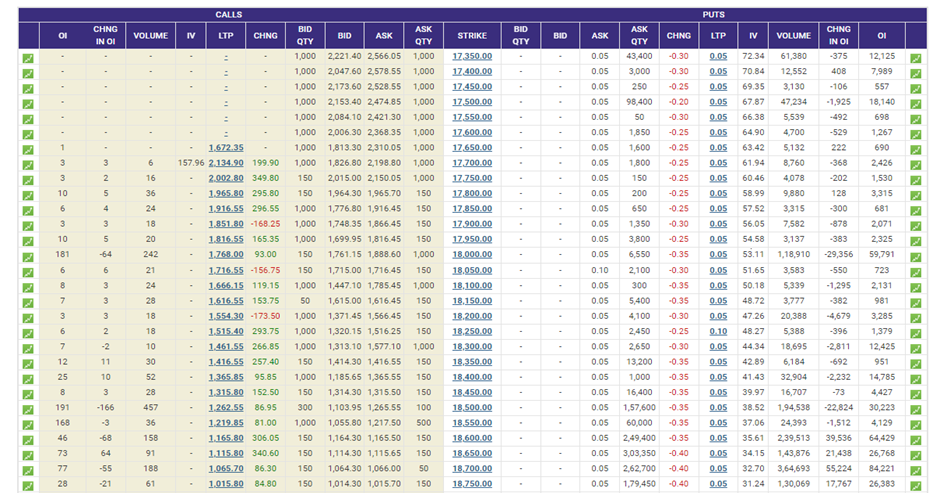
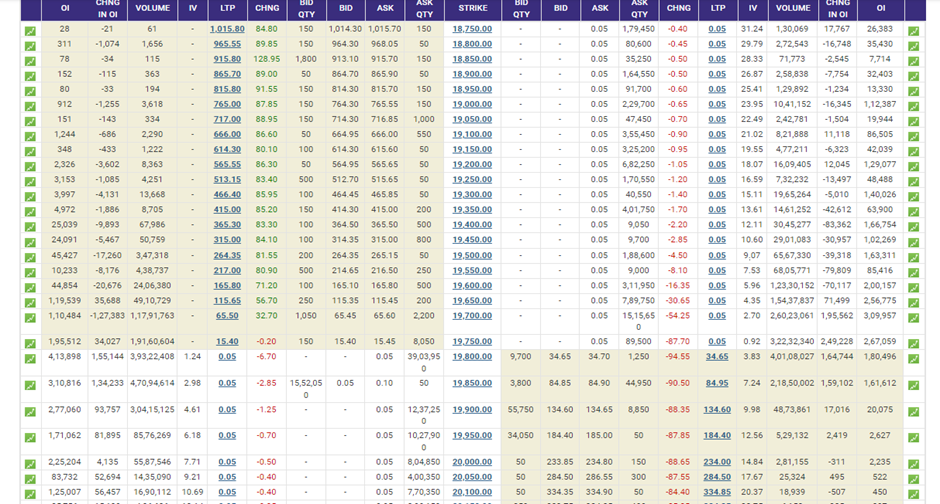
The above image is an example of an option chain that anyone can find on the official website of NSE. The option chain is divided into 2 parts. Calls on the left side and puts on the right side. As you can see there are different strike prices mentioned in the image at which these options are traded. For example, 17350, 17400, 17450, etc. We have already explained the terms that are displayed in the above image as headings. To analyse the option chain first and foremost thing that you need to do is select an underlying asset (Stock, ETF, index)
After choosing the underlying asset determine the expiration date that matches with your trading strategy. Then start reviewing call and put options and select your strike price i.e., the price at which you wish to purchase the underlying asset. Having known the strike price, examine the bid and ask prices i.e., the premiums for the call or put options whichever you want to trade. Check the trading volumes and open interest for the call and the put option whichever you want to trade. Higher volume and open interest indicate more active trading and do not forget to track changes in OI to measure market movement. For example, if the OI of a particular strike price is increasing, chances are likely that traders are predicting NIFTY to be at that level. Recognize if the call or put options are at-the-money, in-the-money, or out-of-the-money. ATM strike prices are the closest to the current level of NIFTY. Suppose the current level of NIFTY is 19670 so our ATM would be 19750. OTM & ITM have generally lesser volumes and OI than ATM options.
For ATM options, the uncertainty is highest as compared to ITM & OTM options because even a small price movement in either direction can change the option from ATM to ITM OR OTM. Premiums are generally higher for ITM options as compared to the ATM or OTM options. Before choosing an option to trade, a trader should consider the intrinsic value and time value. Do have a glimpse over the volumes of option contracts because high trading volumes can indicate increased interest in a particular option. Consider implied volatility (IV). A high or increased IV reflects uncertainty and higher premiums in the market.
The last step is the analysis and proper usage of option Greeks. This can help you analyze the sensitivity of options prices to changes in strike price, volatility, etc. Also, if you look at the option chain you will notice that some part of it is shaded while the other part is white in colour. The upper left shaded part and the lower right shaded part are ITM options while the part which is not shaded is OTM options.
Also, check out our blog about the different charges you have to bear while trading.
Read Also: What is Options Trading?
Conclusion

Analyzing an option chain involves a combination of technical analysis, understanding option pricing, and formulating trading strategies. By systematically going through the information presented in the option chain, you can make more informed decisions in options trading. Additionally, continuous learning and staying updated on market conditions are key elements of successful option chain analysis.
Frequently Answered Questions (FAQs)
What is an option chain?
An option chain is a list of all available contracts for a security or index that displays the call and put options with different strike prices.
What are the Greeks in option chain analysis?
The Greeks (Delta, Gamma, Theta, Vega) are measures that specify the sensitivity of options price to change in various factors.
What role does risk management play in options trading?
Risk management in options trading helps in capital preservation.
What is implied volatility?
It is a measure of the market expectations for price fluctuations in the future.
What is the formula for intrinsic value?
Intrinsic value = current stock price – strike price.
Disclaimer
The securities, funds, and strategies discussed in this blog are provided for informational purposes only. They do not represent endorsements or recommendations. Investors should conduct their own research and seek professional advice before making any investment decisions.