| Type | Description | Contributor | Date |
|---|---|---|---|
| Post created | Pocketful Team | Jun-17-24 | |
| Add internal link | Nisha | Mar-04-25 |
Read Next![]()
- Best Stop Loss Strategies for Day Trading in 2026
- Best ETF Trading Strategies in India
- What is Overnight Trading?
- Why Option Buyers Lose Money in Trading
- Formulas used to Calculate Profit and Loss in Nifty Options
- How to Trade Fake Breakouts Using Options: 5 False Breakout Strategies
- Trade Breakouts with Options Without Overpaying IV
- How to Use MTF in the Stock Market?
- Understanding Bull Put Spread Option Strategy
- NSE Extends F&O Trading Hours by 10 Minutes
- Expiry Day Trading Explained
- High Premium Selling: Risk vs Reward Explained
- Delta Neutral Trading Strategy: What it is & How it works
- Selling Penny Options: Small Gains, Massive Risk
- Hard vs Soft Commodities: Key Differences
- How to Become a Systematic Trader: Beginner’s Guide
- 5-Minute ORB System for Option Scalping
- What is Automated Trading?
- Weekly vs Monthly Expiry in Options Trading: Key Differences
- Opening Range Breakout (ORB) Strategy
What is Price Action Trading & Price Action Strategy?
Published on : 17th June 2024
|Updated on : 25th March 2025
Did you know there is a simple yet powerful concept in trading that focuses solely on the movement of price over time to gauge market sentiments?
We are talking about Price Action Trading, which primarily focuses on trends, chart patterns, candlestick patterns, and major historical price movements to gauge market sentiments. Candlestick patterns help to identify the relationship between buyers and sellers over a period of time by analyzing the open, close, high, and low prices of the candlestick.
What is Price Action Trading?
Price action in trading analyses the price performance of a security, index, commodity, or currency to predict the future. If price action analysis tells us that the price is about to rise, one might want to take a long position, or if one believes that the price action is signaling a negative trend, one might choose to initiate a short trade.
Merits of Price Action Trading
- Simple to understand: This is its biggest advantage; candlestick patterns can be observed on the charts without the need for any complicated technical indicators. Candlesticks itself give the signal of trend change; it’s confirmation or buying and selling signals. Along with that, a few other chart patterns can be observed with a wider time frame, that candlesticks make to give mid to long-term signals like Double bottom, Rounding bottom, Head & Shoulders, etc.
- Easily accessible: Price Action uses only candlesticks which are easily accessible in charts as compared to complicated indicators.
- Without any Lag: All the technical indicators have some lag before generating signals, but Candlesticks move in sync with the price movement.
- Develop Independent thinking: As this method needs close observation and analysis, it engages traders’ analytical and critical thinking skills to make informed trading decisions.
- Universal Application: Traders can make use of price action across all asset classes such as equities, currencies, commodities, etc.
Limitations of Price Action Trading
- Not for all markets: Price action is not a perfect method in all market conditions.
- Time Consuming: Interpretation of candlesticks can be more time consuming as compared to technical indicators because it relies on traders understanding and skills to interpret the patterns accurately. This can impact the decision-making.
- No automation: In price action, most of the traders do manual execution as it is difficult to deploy fully automated price action strategies. This can lead to emotional bias, which eventually hampers the profitability.
Strategies Used in Price Action Trading

A pattern is formed by a group of candles over a certain period of time that creates a unique shape and carries a specific meaning. Such patterns help traders analyze the behavior of buyers and sellers during the formation of the pattern and predict the future direction of price movements.
There are various price patterns that traders should keep an eye on, including Double-bottom and Triple bottom patterns, head and shoulders patterns, cup and handle patterns, wedge patterns, pennants, triangle patterns, and more.
However, correctly identifying these patterns requires traders to have a good understanding of each pattern and observe price charts on different time frames.
Read Also: Price Action Analysis: An Easy Explainer
Best Price Action Trading Strategies
There are numerous Price Action strategies, but learning each one can be challenging. To simplify things, we’ve explained a few key strategies below for your convenience.
1. Hammer
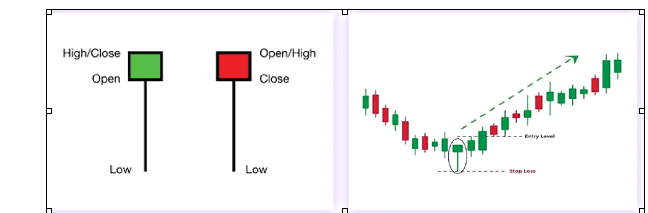
The hammer candlestick pattern, which consists of a short body and a long wick, is found at the bottom of a downward trend.
The colour of the body can vary, but green hammers indicate a stronger bull market than red hammers. If the pin bar/hammer pattern has a long lower tail, this tells the trader that there has been a trend of lower prices being rejected, which implies that the price could rise from here. Generally, the next day is the confirmation day, and if the next day’s price crosses the high of Hammer, then a strong buy signal is generated. Stop loss is the low of Hammer, the entry point is a bullish breakout above Hammer’s high and can continue with the trend till it gets any reversal signal.
2. Bullish Engulfing
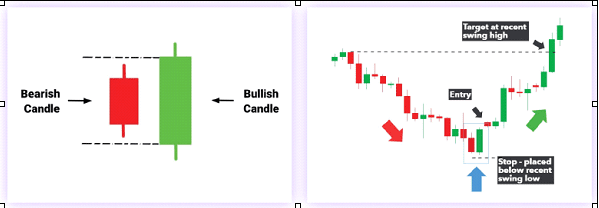
The bullish engulfing pattern is formed by using the two candlesticks. The first candle is a short red body which is completely engulfed by a larger green candle. That’s called bullish engulfing. It signals a potential trend change from down to up, so the next day, even if the price opens a little bit lower, it will be a buying opportunity as bulls are in control and will push the price higher eventually.
The reversal of Bullish engulfing is Bearish engulfing, which occurs after an uptrend.
3. Three White Soldiers
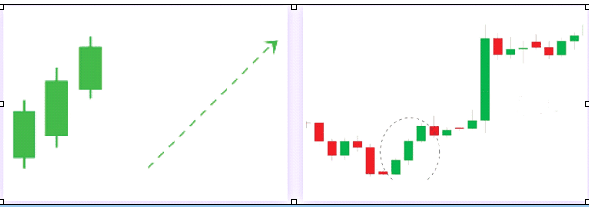
It is a very strong bullish signal that occurs after a downtrend. It’s a three-candle pattern and consists of consecutive long green candles with small wicks and long bodies, which open and close progressively higher than the previous day. The potential direction is up.
In contrast, the reversal of Three White Soldiers is Three Black Crows, which signals a strong bearish trend after an uptrend.
4. Hanging man
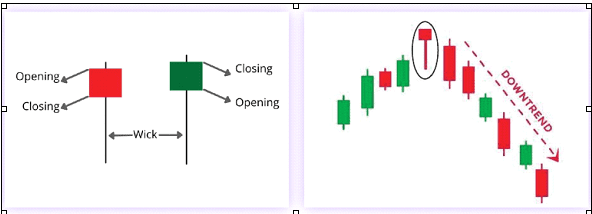
The hanging man is a bearish pattern and it’s the opposite of a hammer. It has the same shape as of a hammer but forms at the end of an uptrend, so, it’s a bearish signal. It indicates that there was a significant sell-off during the day. The large sell-off is often seen as an indication that the bulls are losing control of the market. The next day, a lower close confirms the downtrend. One can continue with the short trade till get any reversal.
5. Head and Shoulders Pattern
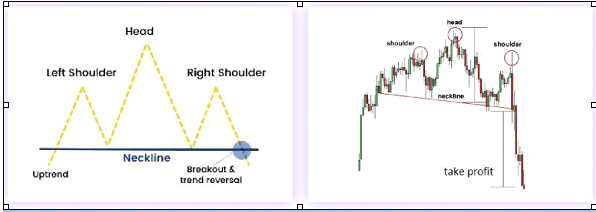
As the name suggests, the head and shoulders pattern is a market movement that looks a bit like the head and shoulders. The head and shoulders trade is one of the most popular price action trading strategies as it’s relatively easy to choose an entry point (generally near the neckline after the breaking of the shoulder) and set a stop loss around or above the left shoulder and set the target at the downside till the length of the head.
A similar pattern can be reversed, called reverse head and shoulder. It works as a bullish signal and gives upside targets.
How to Trade Using Price Action
Traders can follow below mentioned steps to trade using price action:
- Identify the asset class and market you want to trade.
- Analyze the patterns and trends.
- Decide whether to go long or short.
- Build a trading plan, for e.g., entry price, exit price, risk reward ratio, stop loss levels, etc.
- Execute the trade, monitor the position, and make a timely exit.
Conclusion
Price action trading is a powerful tool used by traders all around the world across different markets. It provides a systematic way to analyze the market and gives the direction to initiate a trade. Traders look out for price action signals for the emergence of a trend.
Unlike technical analysis, the Price Action focuses on the price itself and not on other indicators. The more expert a trader will be, the more likely repeated patterns of behavior from buyers and sellers can be found out and traded upon.
Following a set of price action trading rules is important to achieve consistent performance. Always be mindful of the risks involved in trading and make decisions accordingly. Further, for new traders, it is suggested to do paper trading at the initial stages; this will allow them to trade in a virtual environment until they get the confidence and clarity to go live.
Frequently Asked Questions
01
Is Price Action Trading Relevant?
Yes, it’s relevant as it is used to understand the price action and involves looking at the patterns and identifying the key indicators.
02
What do you mean by Price Action Analysis?
Price action is the process of analyzing historical price trends to forecast the direction of prices in the future. It is generally done by analysing the candlestick patterns, which show the relationship between buyers and sellers in a given time period.
03
Is Price Action Trading Good for Beginners?
Yes, price action is suggested to beginners as it is a good starting point for understanding the market through historical trends and predicting future market movements based on that.
04
Are there any strategies involved in Price Action Trading?
Yes, there are a number of different price action methods that traders use to predict market movements, like Head & Shoulder, Hanging Man, etc.
05
What are Candlesticks Patterns?
Candlestick patterns help traders to identify the relationship between buyers and sellers over a period of time by analyzing the candlestick’s open, closed, high, and low prices.
Disclaimer
The information shared in this content is intended solely for educational and informational purposes and should not be considered financial, investment, or trading advice. Any references to stocks, mutual funds, or market instruments are purely for informational purposes and do not constitute recommendations. Investments in financial markets are subject to market risks, and past performance is not indicative of future returns. Readers are advised to conduct independent research, review official documents carefully, and consult a qualified financial advisor before making any investment or trading decisions.