
| Type | Description | Contributor | Date |
|---|---|---|---|
| Post created | Pocketful Team | Apr-30-24 | |
| Add new links | Nisha | Mar-04-25 |
Read Next![]()
- What is Personal Finance?
- Military Wealth Management: Strategies for Growing and Preserving Your Assets
- India’s Republic Day 2025: Honoring the Nation’s Defense Achievements
- 10 Essential Financial Planning Tips for Military Members
- How Do You Apply for PAN 2.0 Online and Get It on Your Email ID?
- 10 Best YouTube Channels for Stock Market in India
- LTP in Stock Market: Meaning, Full Form, Strategy and Calculation
- 15 Best Stock Market Movies & Web Series to Watch
- Why Do We Pay Taxes to the Government?
- What is Profit After Tax & How to Calculate It?
- Budget 2024: Explainer On Changes In SIP Taxation
- Budget 2024: F&O Trading Gets More Expensive?
- Budget 2024-25: How Will New Tax Slabs Benefit The Middle Class?
- Semiconductor Industry in India
- What is National Company Law Tribunal?
- What is Capital Gains Tax in India?
- KYC Regulations Update: Comprehensive Guide
- National Pension System (NPS): Should You Invest?
- Sources of Revenue and Expenditures of the Government of India
- What is Securities Transaction Tax (STT)?

- Blog
- ratio analysis
Ratio Analysis: List Of All Types Of Ratio Analysis
|
|
Have you ever had trouble making sense of the enormous numbers and information provided in a company’s financial reports? Before making any investment decisions, though, it is important to take financials into account because they reflect the company’s overall picture and can be used to analyse the future growth.
In this blog, we will deep dive into the ratio analysis and how it can help you grasp a company’s overall fundamental image.
Overview

Ratio analysis is a method of analysis that compares the financial data of a company. Financial statements, including the income statement and balance sheet, are used to extract the data, which are then compared to each other and help us identify investment opportunities.
Through ratios, we can understand the raw & bland data of the balance sheet and income statement into actionable ideas.
Importance of Ratio Analysis
- The ratio analysis gives us insight into the company’s historical performance, which we can use to forecast its performance in the future.
- Ratios can help you identify areas of weakness in the organization where more effort needs to be made.
- By examining the ratios, investors can decide whether to invest or not and create strategies accordingly.
- Ratio analysis can help investors in comparing a company’s performance with its peers and against the industry.
Types of Ratios
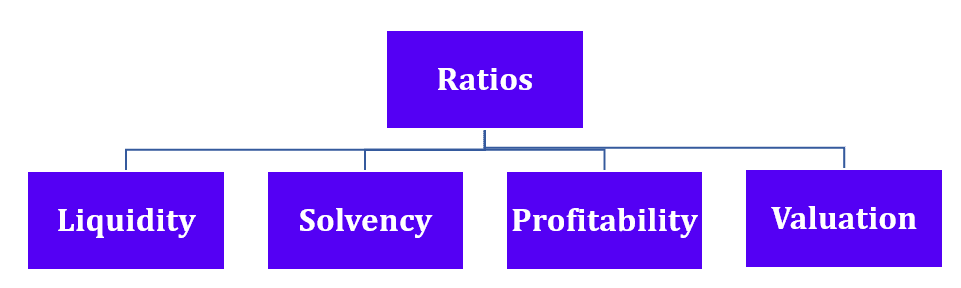
There are four broad categories of ratios:
- Liquidity Ratio – These ratios reflect the company’s ability to pay off its short-term liability / obligations.
- Solvency Ratio – This is also known as the leverage ratio, which reflects the company’s ability to repay its long-term debt & obligations.
- Profitability Ratio – This ratio shows the company’s ability to generate profit from its operating activities.
- Valuation Ratio – This ratio reflects the intrinsic value of a company’s stock as compared to its current market price. It helps in identifying whether a company’s stock price is fairly valued, undervalued, or overvalued.
Let’s have a deeper analysis of each type of ratio.
Read Also: Explainer on Liquidity Ratios: Types, Importance, and Formulas
Liquidity Ratios
Liquidity ratios can be used to assess a company’s capacity to satisfy short-term obligations (debt that must be repaid within a year).
Before granting a loan such as a working capital loan, the company’s creditors typically check this ratio to ensure the company can afford to repay it. An organization’s creditworthiness is harmed if it cannot pay its short-term debts on schedule.
Types of Liquidity Ratios
Generally, there are 3 types of liquidity ratios:
- Current Ratio :
This ratio is calculated to evaluate the company’s ability to sell its short-term assets, such as inventory, and settle its short-term liabilities. It is also known as the working capital ratio.
Current Ratio = Current Asset / Current Liability
A greater than 1 current ratio indicates that the company has more current assets than its current liability. - Quick Ratio :
It is similar to the Current ratio, however, inventory is not taken into account for determining the company’s capacity to meet its short-term obligation. The Acid Test Ratio is another term for it.
Quick Ratio = Current Asset – Inventory / Current Liabilities
Generally, the quick ratio greater than 1 is considered a good number. - Cash Ratio :
Here, Current assets are limited to cash and cash equivalents.
Cash Ratio = Cash and cash equivalent / Current Liabilities.
The ideal cash ratio will be 1 or greater than 1.
Solvency Ratios
To assess a company’s capacity to settle its long-term debts, solvency ratios are computed. Creditors and investors use this ratio to assess the company’s ability to settle long-term obligations.
Types of Solvency Ratios
- Debt to Equity Ratio – This ratio helps in assessing the company’s financial stability.
Debt to Equity Ratio = Total Debt / Total Equity (Lower is better). - Debt Ratio – This ratio evaluates the company’s debt-financed assets. A lower debt ratio indicates greater financial stability and less reliance on debt funding.
Debt Ratio = Total Debt / Total Asset - Interest Coverage Ratio – It measures the company’s ability to cover its interest expense by its earnings before interest and taxes, which is generally known as EBIT. A higher ratio signifies a strong ability to meet the company’s interest obligations.
Interest Coverage Ratio – EBIT / Interest Expense - Debt Service Coverage Ratio – This ratio assesses how well the business can use operational profits to pay its debt. It is measured by the amount of cash flow that can be used to pay down debt principal and interest.
Debt Service Coverage Ratio = Net Operating Income / Total Debt Service.
Profitability Ratios
The profitability ratios are helpful in assessing a company’s profitability on several metrics, such as equity, sales, and assets. It allows us to assess how well a business uses its resources to generate profits. The higher the profitability ratios, the better it is for the company.
Some commonly used profitability ratios are:
- Gross Profit Margin – It paints a picture of how a business effectively runs its manufacturing process.
Gross Profit Margin = (Revenue – COGS) / Revenue * 100 - Net Profit Margin – It is computed as a percentage of revenue, which is what’s left over after all costs, including taxes, interest, operating expenses, and cost of products sold, are subtracted.
Net Profit Margin = Net Income / Revenue * 100 - Return on Equity (ROE) – The ROE measures the company’s ability to generate profit from shareholder’s equity. Through ROE, one can estimate the return earned by the company on shareholder’s fund.
Return on Equity = (Net Income / Average Shareholder’s Equity) *100 - Earnings Per Share – It is used to evaluate a company’s profitability on a per-share basis, or in other words, the amount of net income attributable to each outstanding share of common stock.
Earnings Per Share = (Net Income – Preferred Dividends) / Average no. of outstanding shares
Valuation Ratios
These are used to calculate the intrinsic value of a company’s stock as compared to its current market price. This can evaluate whether a company’s stock price is fairly valued, undervalued, or overvalued.
A few valuation ratios used by investors for evaluating a company’s stock price are:
- Price to Earnings Ratios – The P/E ratio means how much an investor is willing to pay for each rupee earned by the company. A higher ratio reflects that investors are expecting higher growth, but a higher PE ratio sometimes also suggests that a stock might be overvalued.
Price to Earnings Ratio = Market price per share / Earnings per share (EPS). - Price to Book Value – In this, the stock price of a company is compared to its book value per share. It indicates whether a company’s stock is selling above or below its book value.
Price to Book Value = Market price per share / Book value per share. - Price to Sales Ratio – This ratio helps us in comparing a company’s stock price to its sales or revenue per share. It reflects how much an investor is willing to pay for every INR of a company’s sales. The higher ratio suggests that the company is growing rapidly, although it also suggests that the stock is overvalued.
Price to Sales Ratio = Market Price per share / Sales per share.
Read Also: Ratio Analysis: List Of All Types Of Ratio Analysis
Conclusion
In summation, financial ratios are a valuable tool for assessing a company’s performance. A company’s capacity to pay off debt, make a profit, allocate resources effectively, etc. can be better understood by examining several ratios discussed above, including those related to profitability, liquidity, solvency, and valuations.
Nevertheless, they have limitations and do not provide any valuable insights if used in isolation. Therefore, the best method to analyze a ratio is to compare it to the company’s peers to gain a better knowledge of it.
However, before making any investments, do a thorough research after considering your risk profile. The ratios alone are not sufficient criteria for investing in any company.
Also give this a read to boost your investing strategy – 5 points to considered before buying and selling any stocks.
Frequently Asked Questions (FAQs)
Are there any limitations of the ratio analysis?
Yes, although ratios have their own merits, they also have a few limitations, such as ignoring inflation, qualitative aspects such as goodwill, etc.
How frequently should one carry out ratio analysis?
Ratio analysis should be performed on a regular basis, ideally, quarterly or annually.
How do we analyze the ratios?
One must compare the ratios with the industry average or other peer companies.
What are liquidity ratios?
Liquidity ratios assess a company’s capacity to satisfy its short-term debt & obligations (debt that must be repaid within a year).
Is Return on Equity (ROE) a profitability or valuation ratio?
The Return on Equity (ROE) is a profitability ratio that measures the company’s ability to generate profit from shareholder funds.
Disclaimer: The securities, funds, and strategies mentioned in this blog are purely for informational purposes and are not recommendations.
Disclaimer
The securities, funds, and strategies discussed in this blog are provided for informational purposes only. They do not represent endorsements or recommendations. Investors should conduct their own research and seek professional advice before making any investment decisions.