| Type | Description | Contributor | Date |
|---|---|---|---|
| Post created | Pocketful Team | Sep-09-24 |

- Blog
- tata power vs adani power
Tata Power Vs Adani Power: Comparison Of Two Energy Giants

Did you know that the energy sector plays a crucial role in supporting not just the India’s industrial growth but also the overall economy? If we put aside two PSUs, i.e., NTPC and Power Grid, two major players leading in this sector are Tata Power and Adani Power.
In this blog, we will delve into a detailed comparison of these energy giants, their financial performance, and key performance indicators.
Tata Power Overview
Tata Power Limited, a flagship company of the Tata Group, was established in 1915 and has been a pioneer in the Indian power sector. It is headquartered in Mumbai and operates across the entire power value chain – generation, transmission, distribution, and renewable energy. It also offers next-generation solutions including solar rooftop and EV charging stations.
As of August 2024, the company has a diversified portfolio of 14,707 MW, spanning across renewable and conventional energy generation. The company is known for its focus on clean and sustainable energy solutions, boasting one of the largest portfolios of renewable energy in India.
Tata Power’s operations span across various segments including thermal power, hydroelectric power, solar power, and wind power. Further, Tata Power has also committed to achieve carbon neutrality before 2045.
Did You Know?
Tata Power established Mumbai’s electric vehicle charging stations. And it is now present in Delhi and Hyderabad as well.
Adani Power Overview
Adani Power Limited is a part of the diversified Adani Group. It was founded in 1996 and has rapidly grown to become one of the largest private sector power producers in India. The company operates in both thermal and renewable energy segments and is recognized for its large-scale power projects.
As of August 2024, the company has a power generation capacity of 15,250 MW and has thermal power plants in Gujarat, Maharashtra, Karnataka, Rajasthan, Chhattisgarh, Madhya Pradesh, and Jharkhand.
The company is known for its aggressive expansion strategies and its commitment to contributing to India’s energy security.
Did You Know?
Adani Power Limited is the largest private thermal power producer in India.
Comparative Study of Tata Power and Adani Power
| Particulars | Tata Power | Adani Power |
|---|---|---|
| Current Price (CMP) | INR 431 | INR 637 |
| Market Capitalization (in crores) | INR 1,37,815 | INR 2,45,840 |
| 52-Week High Price | INR 471 | INR 897 |
| 52-Week Low Price | INR 231 | INR 289 |
| FIIs Holdings (June 24) | 9.50% | 14.73% |
| DIIs Holdings (June 24) | 15.50% | 1.42% |
| Book Value per Share | INR 101 | INR 112 |
| PE Ratio (x) | 37.5 | 15.4 |
Read Also: Adani Enterprises Case Study: Business Model And SWOT Analysis
Financial Statements Comparison
Let’s have a look at the financials of Tata Power and Adani Power.
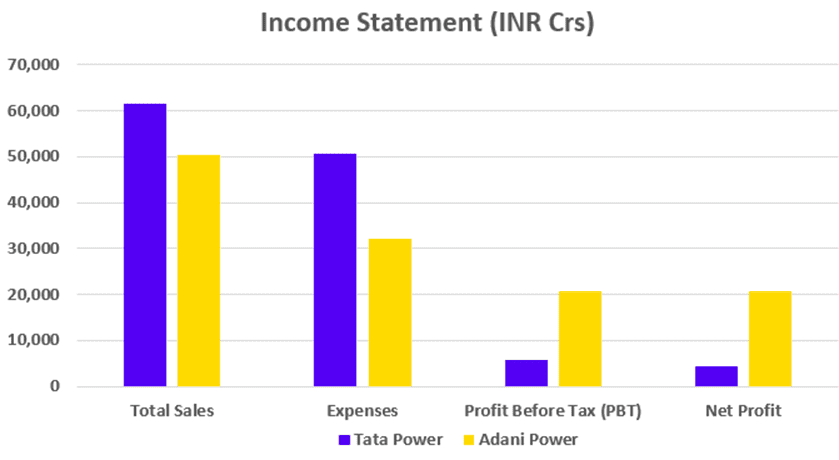
Income Statement (FY 2024)
| Particulars | Tata Power (INR crore) | Adani Power (INR crore) |
|---|---|---|
| Total Sales | 61,449 | 50,351 |
| Expenses | 50,714 | 32,124 |
| Profit Before Tax (PBT) | 5,732 | 20,792 |
| Net Profit | 4,280 | 20,829 |

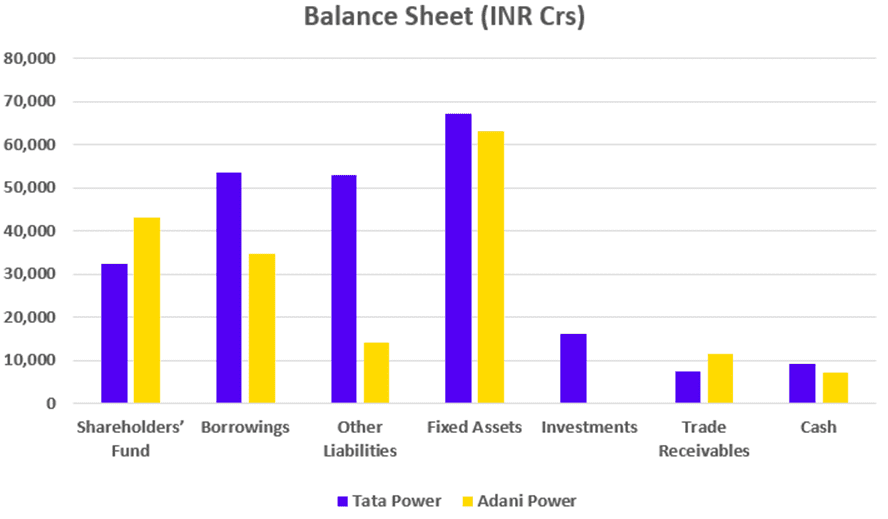
Balance Sheet (FY 2024)
| Particulars | Tata Power (INR crore) | Adani Power (INR crore) |
|---|---|---|
| Shareholders’ Fund | 32,356 | 43,145 |
| Borrowings | 53,689 | 34,616 |
| Other Liabilities | 53,010 | 14,248 |
| Fixed Assets | 67,210 | 63,016 |
| Investments | 16,316 | 374 |
| Trade Receivables | 7,402 | 11,677 |
| Cash & Cash Equivalents | 9,152 | 7,212 |

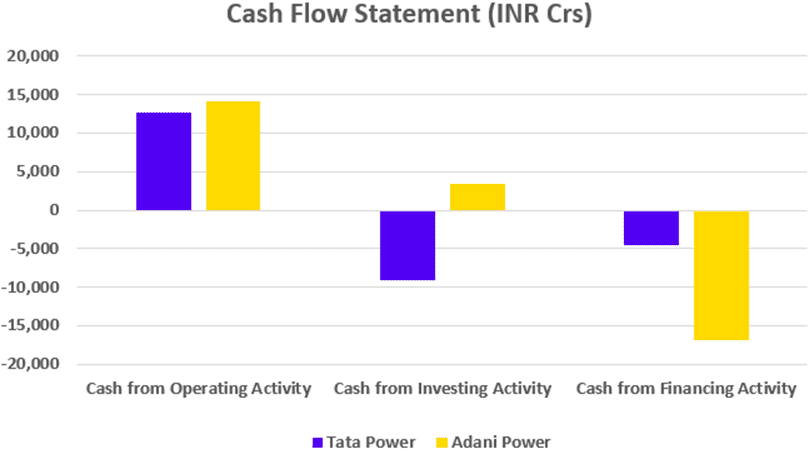
Cash Flow Statement (FY 2024)
| Particulars | Tata Power (INR crore) | Adani Power (INR crore) |
|---|---|---|
| Cash from Operating Activity | 12,596 | 14,170 |
| Cash from Investing Activity | (9,027) | 3,481 |
| Cash from Financing Activity | (4,497) | (16,864) |

Key Performance Indicators (FY 2024)
| Particulars | Tata Power | Adani Power |
|---|---|---|
| Operating Profit Margin | 17% | 36% |
| ROE | 11.30% | 57.10% |
| ROCE | 11.10% | 32.20% |
| Earnings Per Share | INR 11.57 | INR 54 |
Read Also: Adani Penny Stock and List of Lowest-Priced Adani Shares
Conclusion
In summation, the comparison between Tata Power and Adani Power highlights the strengths and market positions of both companies in the Indian energy sector. While Tata Power enjoys a legacy of over a century with a strong focus on sustainability, Adani Power’s aggressive growth strategies have made it a formidable competitor in the industry.
Investors can find value in both companies based on their preferences and risk tolerance. It’s advisable to consult with a financial advisor before making any investment decision.
| S.NO. | Check Out These Interesting Posts You Might Enjoy! |
|---|---|
| 1 | Tata Motors vs Maruti Suzuki |
| 2 | Tata Steel vs. JSW Steel |
| 3 | Apollo Hospitals vs Fortis Healthcare: |
| 4 | Tata Steel vs. JSW Steel |
| 5 | MRF vs Apollo Tyres |
Frequently Asked Questions (FAQs)
When was Tata Power founded?
Tata Power was founded in 1915 and is one of the oldest power companies in India.
Which company has a larger market capitalization: Tata Power or Adani Power?
As of August 2024, Adani Power has a larger market capitalization of INR 2.46 lakh crore, compared to Tata Power’s INR 1.38 lakh crore.
What are the main areas of operation for Tata Power and Adani Power?
Tata Power operates across the entire power value chain, including generation, transmission, distribution, and renewable energy. On the other hand, Adani Power primarily focuses on large-scale thermal power projects but also has a significant presence in renewable energy.
Which company is more profitable: Tata Power or Adani Power?
As of FY 2024, Tata Power reported a net profit of INR 4,280 crore, while Adani Power reported a net profit of INR 20,829 crore.
What is Tata Power’s PE Ratio compared to Adani Power’s?
As of August 2024, Tata Power’s PE Ratio is 37.5, while Adani Power’s PE Ratio is higher at 15.4.
Disclaimer
The securities, funds, and strategies discussed in this blog are provided for informational purposes only. They do not represent endorsements or recommendations. Investors should conduct their own research and seek professional advice before making any investment decisions.