| Type | Description | Contributor | Date |
|---|---|---|---|
| Post created | Pocketful Team | Dec-08-23 | |
| Add new links | Nisha | Mar-13-25 |

- Blog
- top indicators used by intraday traders in scalping
Top Indicators Used By Intraday Traders In Scalping


Ever heard of the term “Scalping”? What is it, how traders use it, etc? Don’t worry, we will unwind all these questions in this blog.

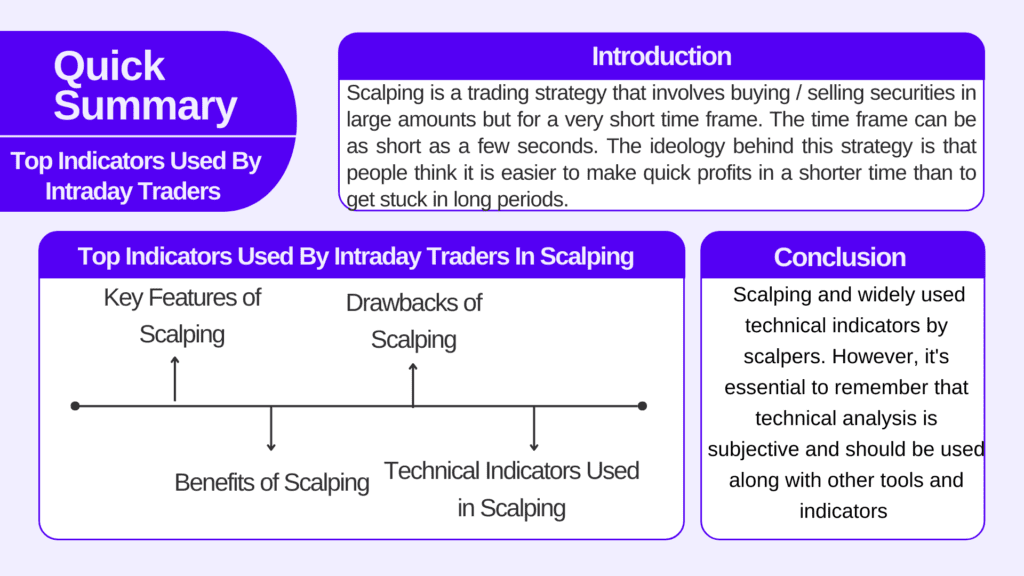
Scalping is a trading strategy that involves buying / selling securities in large amounts but for a very short time frame. The time frame can be as short as a few seconds. The ideology behind this strategy is that people think it is easier to make quick profits in a shorter time than to get stuck in long periods.
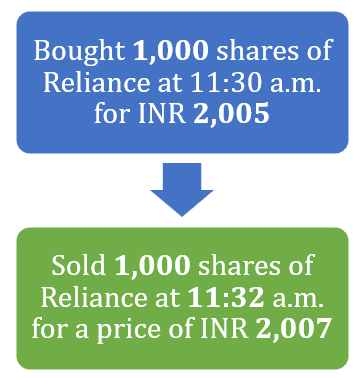
Illustration of a Scalp Trade:

Traders who do scalping are often known as “scalpers.” Scalpers use a combination of technical indicators for quick decisions and the identifying entry and exit points. In this blog, we will learn about the technical indicators that scalpers often use.
Key Features of Scalping
1. The time frame used by most scalpers ranges from 1 minute to 15 minutes. In a few cases, it can be as low as a few seconds.
2. Generally, scalping is considered less risky than long or multiple-time frame strategies such as swing trading or positional trading.
3. High Frequency Traders (HFTs) indulge in scalping and generally use Algorithmic trading.
4. Scalpers often trade with pre-determined entry and exit levels and are quick to take off profits or book losses.
Benefits of Scalping
1. Less risky: As discussed, scalpers trade in a very short time frame with pre-defined entry and exit levels, eliminating the potential risk of significant losses.
2. Only technical, no fundamental: Scalpers operate in a short time frame where decisions are purely based on technical indicators and no fundamental analysis (stock news, events, financial analysis) is used.
3. All-weather strategy: Scalping is an all-weather strategy that can be used in bullish as well as bearish markets.
Drawbacks of Scalping
1. Transaction Costs: Scalpers indulge in multiple trades during the day, which results in very high transaction costs, including but not limited to: Brokerage, STT, Stamp duty, Exchanges fees, etc. In cases of low margins, transaction costs often eat up entire profits.
Check out our blog: Different Types of Charges in Online Trading
2. Tech Issues: Scalping means buying or selling in a very short time frame, and scalpers often use algorithmic trading. Even a few seconds of delay can significantly hamper the outcome of a trade and tech issues are common in India, including broker-related glitches, internet connectivity, etc.
3. May not be suitable for illiquid securities: Scalpers generally prefer trading in highly liquid securities, as to buy / sell in large quantities, liquidity is a must requirement. In certain markets, liquidity is not enough, which shortens the horizons of scalpers, and they end up trading in scattered markets.
4. Shorter time frames are less reliable: As explained above, they trade in a very short time frame. However, there is a general phenomenon: the longer the period, the more reliable the indicator. Therefore, scalpers are prone to false signals which increases their challenges.
Read Also: What is Scalping Trading Strategy?
Technical Indicators Used in Scalping

So far, we have discussed scalping, its key features, merits, and demerits. Let’s deep dive into the most commonly used intraday technical indicators used by scalpers for trading in equity, commodities, and forex markets:
1. Moving Averages
Moving averages are price-based indicators, meaning they combine current and historical prices. It is the average of the price of security over a specified number of periods. The most popular moving average periods used by traders are the 20, 60, 100, and 200 periods. A widely followed moving average crossover signal is between 50 and 200 periods, often referred to as the “Golden Cross”.
Moving averages can be of multiple types and are less volatile than the price of a security. The most popular averages used by traders are: Simple Moving Average (SMA) and Exponential Moving Average (EMA). The key difference between the two is that SMA uses equal price weights while EMA gives more weight to the recent prices.
Moving averages are often used to identify potential buy or sell levels. When a moving average of a particular time frame, say 20 periods, crosses another moving average of another time frame, say 50 periods, it is a bullish crossover. They are also used to identify support and resistance levels; the longer the timeframe, the stronger the support or resistance level.
2. MACD Indicator
Moving Average Convergence Divergence (MACD) is a momentum technical indicator formed by the difference between short-time frame and long-time frame moving averages. It is formed by the two lines:
- MACD Line: It is the difference between two EMA of different time frames (generally 26 and 12 periods).
- Signal Line: It is the EMA (9 periods) of the MACD line.
It is often used to identify potential buy or sell signals. When the MACD line crosses above the signal line, it indicates a buying signal, or vice versa.
3. Bollinger Bands
Renowned trader John Bollinger developed Bollinger bands. Bollinger bands provide an approximate range of security that is expected to trade within. It consists of three bands: the upper, middle, and lower bands. While the middle band is the moving average of a particular time frame, say 20 periods, the upper and lower bands are decided based on the standard deviation.
The more volatile the security, the higher the standard deviation and wider the range of upper and lower bands.
4. Relative Strength Index
It measures the level of recent price change in a security computed over a rolling time period. It is used to evaluate overbought or oversold zones. It can also be used to identify potential reversal points. It moves in a range of 0 to 100.
Generally, an RSI above 70 is considered an overbought zone, while an RSI below 30 is considered an oversold zone.
5. Stochastic Oscillator
The stochastic oscillator is a momentum indicator developed in 1950 and used to identify overbought or oversold zones. It is formed by comparing the closing price of a security to a range of its prices, say the 14-day moving average.
It ranges from 0 to 100, and generally, above 80 means security is in overbought zone and below 20 means security is in oversold zone.
Relative Strength Index (RSI) and Stochastic Oscillator are both used to measure momentum. RSI is widely used in directional markets, and stochastic oscillators are widely used in sideways markets.
6. Fibonacci Retracement
The Fibonacci sequence, discovered by an Italian mathematician, has applications in various aspects of life, including technical analysis in the financial markets. It is a set of steadily increasing numbers where each number is equal to the sum of the preceding two numbers. Example: 0, 1, 1, 2, 3, 5, 8,…
Fibonacci Retracement is a popular tool used in technical analysis to identify potential levels of support and resistance and has great relevance in the technical analysis world. The most common “Fibonacci Retracement” levels are 23.6%, 38.2%, and 61.8%
Analysing the potential level of retracement using “Fibonacci levels” offers great insights to a trader.
Checkout our blog: Fibonacci Retracement: Complete Guide on How to Use and Strategy
7. Parabolic SAR
Parabolic SAR (stop and reverse), or PSAR, is a technical indicator developed by American engineer J. Wells Wilder. The “Parabolic SAR” indicator is a series of dots plotted either above or below the price of the security. When a security is in a bullish trend, a dot is positioned below the price; in a bearish trend, it is positioned above the price.
It is often used to identify the trend’s direction and potential buy / sell signals. Further, it is used by traders to determine the range of trailing stop-loss orders.
The de-merit of PSAR is that sometimes it may generate false signals, which results in poor earnings for scalpers.
Read Also: How to Choose Stocks for Intraday the Right Way?
Conclusion
In this blog, we have unwinded scalping and widely used technical indicators by scalpers. However, it’s essential to remember that technical analysis is subjective and should be used along with other tools and indicators for more comprehensive decision-making.
Although it is not suggested to new traders, if one wants to start scalping trading, making quick decisions, proper strategy, and risk management are must-haves to become a successful scalper.
Further, the indicators that we have discussed above are useful for traders, but it’s essential to remember that no analysis method guarantees 100% prediction and prudent risk management is crucial in trading whether it is scalping or positional trading.
Frequently Asked Questions (FAQs)
What is the time frame used by scalpers?
Generally, scalpers trade in the 1 minute to 15 minute range.
What are the most common Fibonacci Retracement levels?
23.6%, 38.2%, and 61.8%
Can scalpers trade in bearish markets?
Yes, scalping is a all weather strategy.
Is there a need for Fundamental analysis in scalping?
No, scalping is purely based on technical analysis
Does an RSI of 90 indicates an overbought or an oversold zone?
Traditionally, an RSI above 70 indicates an overbought zone.
Disclaimer
The securities, funds, and strategies discussed in this blog are provided for informational purposes only. They do not represent endorsements or recommendations. Investors should conduct their own research and seek professional advice before making any investment decisions.