| Type | Description | Contributor | Date |
|---|---|---|---|
| Post created | Pocketful Team | Jul-24-24 | |
| Add new links | Nisha | Mar-18-25 |
Read Next![]()
- What Is Leverage in the Stock Market?
- Common Trading Mistakes Beginners Make (And How to Avoid Them)
- How to Pledge ETFs for Margin in India
- What Is Expiry Day Trading?
- Best ETF Platforms for Trading and Investment in India 2026
- What Is Strike Price in Options Trading?
- What is Speculative Trading?
- What is Revenge Trading?
- What Is Time Decay in Options?
- What are Candlestick Patterns? 38 Candlestick Patterns Every Trader Must Know
- How to Read Stock Charts: A Beginner’s Guide to Chart Analysis
- What is Gold Trading?
- Top Algo Trading Programming Languages in 2026
- What is Short-Term Trading Vs Long-Term Trading Strategies?
- NSE Algo Trading Rules for Retail Traders in India
- What is a Harami Candlestick Pattern?
- What is Average Traded Price in Stock Market
- What is MIS in Share Market?
- 7 Common Mistakes in Commodity Trading New Traders Must Avoid
- Brokerage Charges in India: Explained
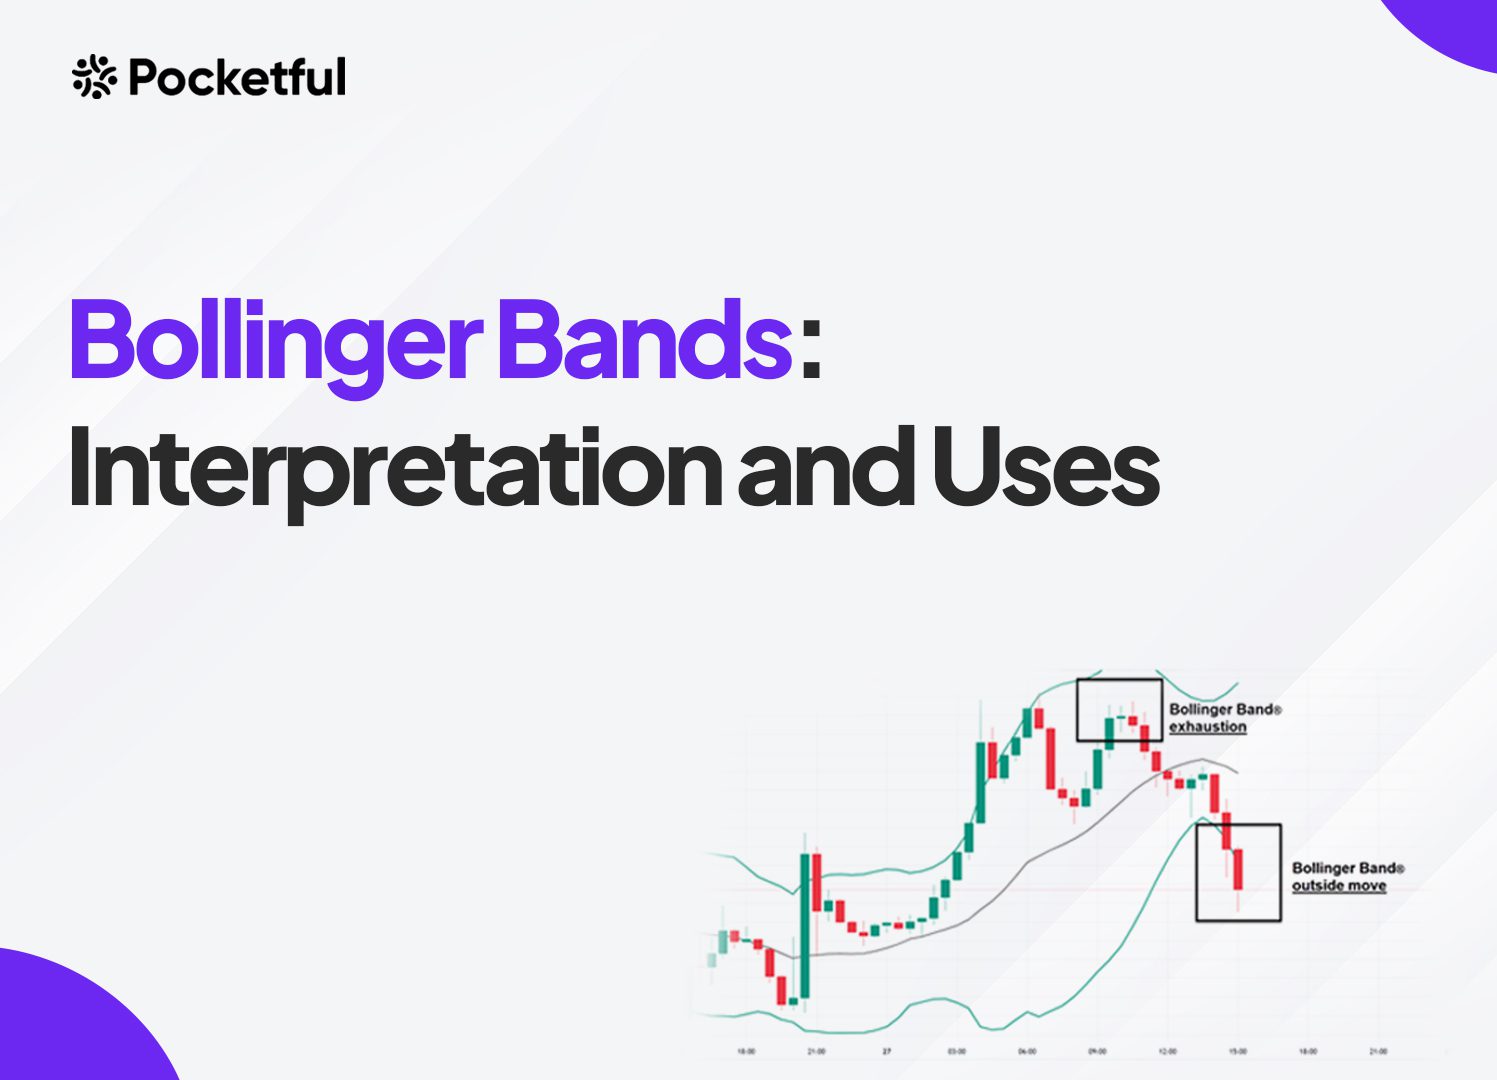
Bollinger Bands: Interpretation and Uses
Written by : Pocketful Team
|Updated by : Pocketful Team
Published on : 24th July 2024
|Updated on : 18th March 2025
As investors, to gain higher returns, you always need to know the stock trends and then make the trading decision. One of the best ways to gauge the trend is to use technical analysis tools. It gives us an overview of market volatility and stock trends. There are a variety of indicators that a professional trader uses to make investment decisions. Bollinger Bands is one popular indicator among them.
In this blog, we have covered Bollinger Bands, its mechanism, and practical applications.
What are Bollinger Bands?
Bollinger Band is the technical analysis indicator that was developed by John Bollinger in the 1980s. These consist of three lines plotted on a price chart: a simple moving average (SMA) in the middle and two standard deviation bands, one above and one below the SMA. There are two parameters on which it works, they are:
- Period: By default, 20 days are considered for technical analysis.
- Standard Deviation: It is calculated based on stock highs and lows.
Key Components of Bollinger Bands
Bollinger Bands consists of three main bands listed below:
1. Middle Band (Simple Moving Average): The simple moving average is usually set to 20 days. It represents the average price over a specific time frame.
Middle band = 20 day SMA.
2. Upper Band: It is the SMA plus two standard deviations (SD). It marks the upper boundary of price movement.
Upper band = 20 day SMA + (2 * 20 day SD of price)
3. Lower Band: It is the SMA minus two standard deviations(SD). It marks the lower boundary of price movement.
Lower band = 20 day SMA – (2 * 20 day SD of price)
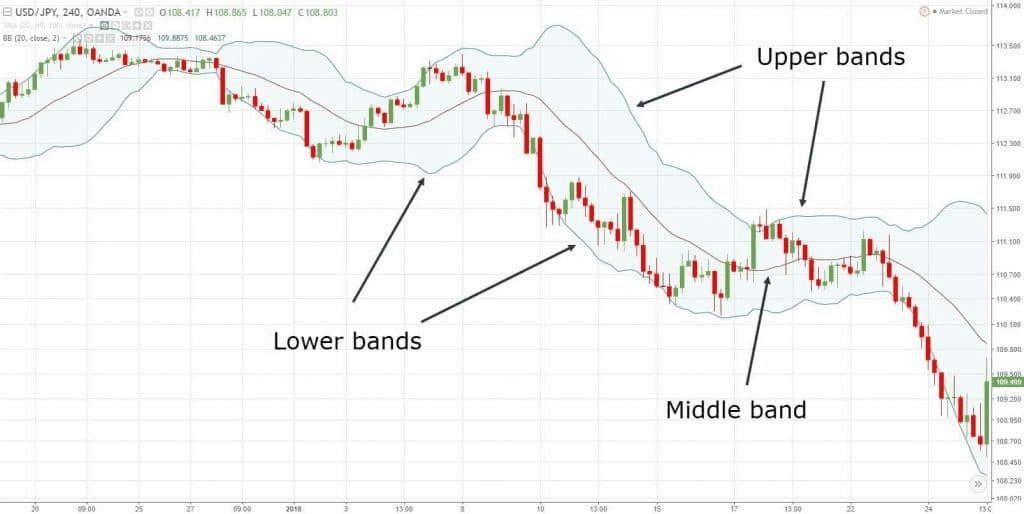
Diagram 1: Picture showing three components of the Bollinger Band
Interpretation of Bollinger Bands
There are three situations in which Bollinger Bands helps you identify the stock condition according to the band movement.
- Overbought Conditions: When the price moves towards the upper band, it indicates that the asset is overbought. This can be a signal that the price might fall in the future.
- Oversold Conditions: When the price moves towards the lower band, it indicates that the asset is oversold. It signals that the price might increase in the future.
- Volatility Indication: The distance between the upper and lower bands widens during high volatility periods and contracts during low volatility. This helps traders anticipate potential breakout scenarios.
Uses of Bollinger Bands
Bollinger Bands has the following uses:
- Spotting Trend Reversals: The price crossing above the middle band (SMA) can signal an uptrend, while crossing below can signal a downtrend.However, Bollinger Bands must be used with indicators like RSI or MACD to confirm trend reversals.
- Bollinger Band Squeeze for Breakout Trading: Contraction of bands indicates low volatility and a potential breakout in the near future.If a breakout occurs with an increase in volume, then traders can enter positions in the breakout direction.
- Setting Stop-Loss and profit-booking levels: Traders usually place stop-loss orders just outside the bands for protection against breakouts.The middle or opposite band of the Bollinger Bands can be considered as a profit-booking level.
Examples
- Example 1: The price of a stock touches the upper Bollinger Band, indicating a potential overbought condition. Trader decides to wait for confirmation before making a decision.If the price crosses below the middle band, you can decide to sell or short the stock.
- Example 2: After a period of consolidation with narrow bands, the price breaks above the upper band with high volume. You enter a long position, anticipating a strong upward move.
- Example 3: A trader with a long position places a stop-loss slightly below the middle band to protect against losses and uses the upper band level as the profit-booking level.
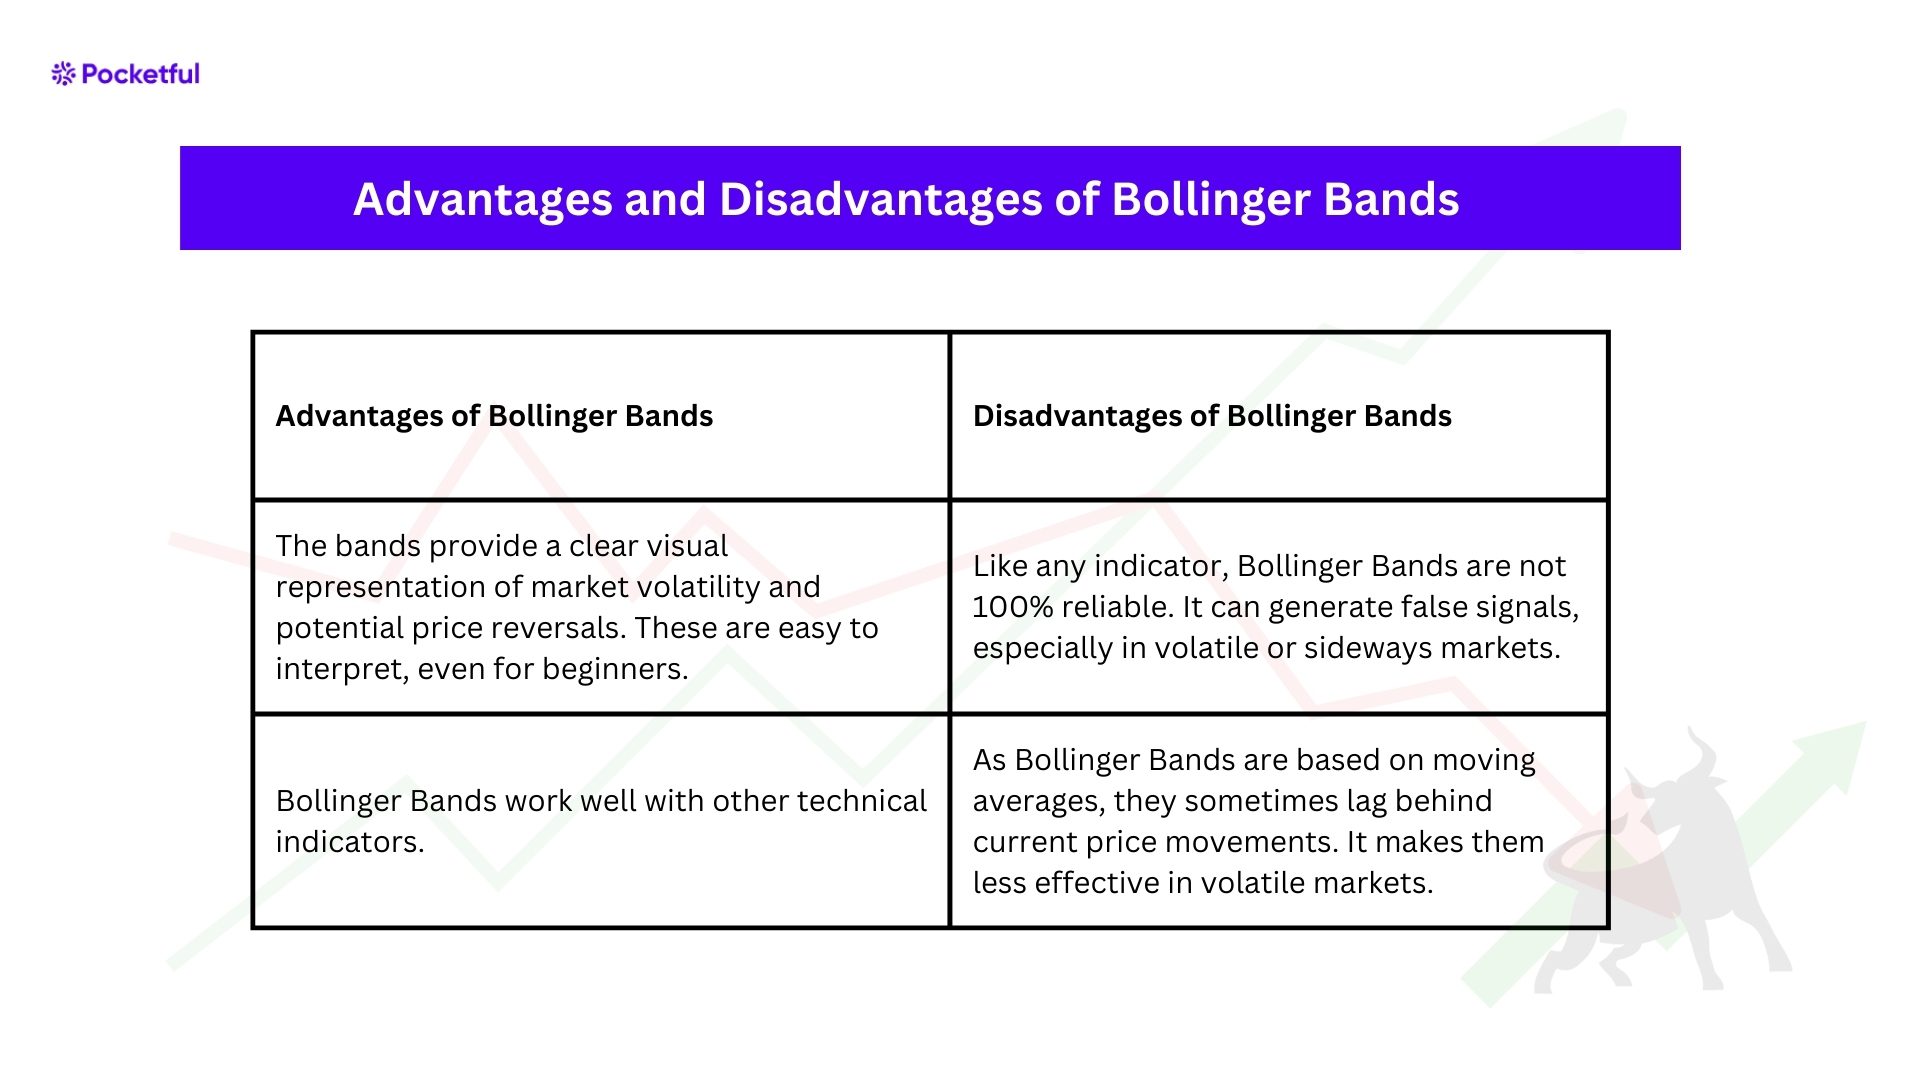
Advantages and Disadvantages of Bollinger Bands
| Advantages of Bollinger Bands | Disadvantages of Bollinger Bands |
|---|---|
| The bands provide a clear visual representation of market volatility and potential price reversals. These are easy to interpret, even for beginners. | Like any indicator, Bollinger Bands are not 100% reliable. It can generate false signals, especially in volatile or sideways markets. |
| Bollinger Bands work well with other technical indicators. | As Bollinger Bands are based on moving averages, they sometimes lag behind current price movements. It makes them less effective in volatile markets. |
Read Also: Breakout Trading: Definition, Pros, And Cons
Conclusion
Bollinger Bands are an easy way to identify market trends, volatility, and reversals. After knowing how to interpret and apply Bollinger Bands, you can improve your trading strategies and increase your chances of success in the market. However, it is advised to consult a financial advisor before making any investment decision.
Frequently Asked Questions (FAQs)
01
Can Bollinger Bands be used in any timeframe?
Yes, Bollinger Bands work on all timeframes, from intraday to monthly charts, making them versatile for various trading strategies.
02
How do I customize the settings for Bollinger Bands?
Adjust the standard 20-period SMA and 2 standard deviations based on your trading style. For the short term, use a 10-period SMA with 1.5 standard deviations, and for the longer term, a 50-period SMA with 2.5 standard deviations is appropriate.
03
Can Bollinger Bands be used with other indicators?
Yes, they are often paired with indicators like RSI to identify overbought/oversold conditions and volume indicators for validating breakouts.
04
How do Bollinger Bands react to sudden market news?
They expand or contract based on price movements and volatility. Sudden news causing significant price changes will lead to rapid band widening, which indicates increased volatility.
05
Are Bollinger Bands effective in all market conditions?
Bollinger bands are less effective in choppy or sideways markets, where prices oscillate without clear direction. It will potentially generate false signals. Use them with other analysis techniques for confirmation.
Disclaimer
The securities, funds, and strategies discussed in this blog are provided for informational purposes only. They do not represent endorsements or recommendations. Investors should conduct their own research and seek professional advice before making any investment decisions.
