
| Type | Description | Contributor | Date |
|---|---|---|---|
| Post created | Pocketful Team | Apr-18-24 | |
| Add new links | Nisha | Mar-18-25 |
Read Next![]()
- MCX Trading: What is it? MCX Meaning, Features & More
- Top 10 Intraday Trading Strategies & Tips for Beginners
- How to Use Pivot Points in Intraday Trading?
- What is Intraday Trading?
- Understanding Intraday Trading Timings
- How to Choose Stocks for Intraday the Right Way?
- Blending Candlestick Patterns: How It Works, Benefits & Drawbacks
- Market Order Vs Limit Order: What’s the Difference?
- Silver Futures Trading – Meaning, Benefits and Risks
- What is Crude Oil Trading and How Does it Work?
- Top Algorithmic Trading Strategies of 2025
- What is Paper Gold? – Meaning, Types, & Benefits
- What is Algo Trading?
- What is Tick Trading? Meaning & How Does it Work?
- Rising Window Candlestick Pattern
- Black Candle Pattern
- Piercing Pattern
- High-Wave Candlestick Chart Pattern
- Closing Black Marubozu Candle
- What is the Best Time Frame for Swing Trading?
What are Candlestick Patterns? Overview and Components
|
|
Investing directly in stocks can generate more income, but you’re probably next thinking about how to identify the best stock and make predictions about whether its value will increase or decrease. Candlestick patterns are used by both seasoned and new traders to make such predictions.
Use this blog as a beginner’s guide to candlestick patterns.
Overview
Candlestick patterns are used by technical analysts to forecast the direction of stock price movement. Every candlestick represents a different time interval, such as a minute, hour, day, etc.
Parts of Candlestick
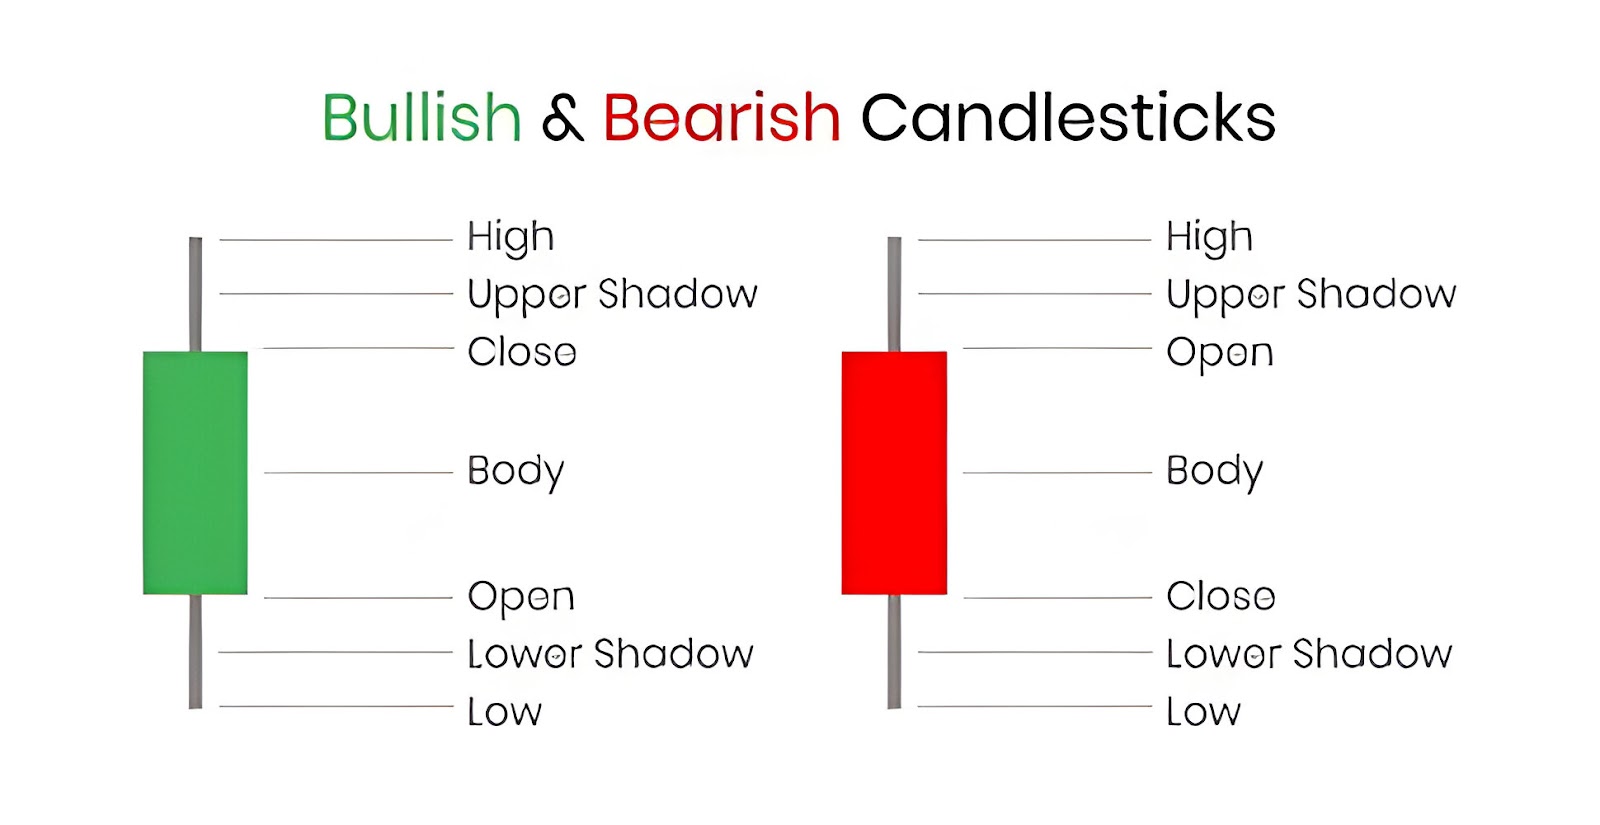
There are four major components of a candlestick.
- Open Price – This is the price at which a security begins trading in a time frame.
- High Price – This refers to the highest price at which a security has traded in a particular time frame.
- Low Price – This is the lowest price where the security has traded in a time frame.
- Close Price – This is the price at which security last traded in a time frame.
Components of Candlestick
- Body – The candle’s body refers to the area between the opening and closing price of a particular security over a time frame.
- Wick – Also known as the candle’s shadow, the wick is the thin line extending above and below the body. It reflects the highest and lowest stock prices a stock touches over a time frame.
Colors of Candlestick
Green or White – This coloured candle shows that the close price is higher than the open price and thus reflects an upward or bullish trend in the market.
Red or Black – This signifies a bearish trend in security as it indicates that the closing price is lower than the opening price.
Importance of Candlestick Pattern
- The candlestick pattern allows us to visually represent price movements.
- Candlestick patterns can be used with technical indicators to provide a better insight into the movement of stock.
- It assists the traders in managing their portfolio risk by helping them predict their exit.
- The size and color of the candle help traders understand the market sentiment.
Read Also: Introduction to Bullish Candlestick Patterns: Implications and Price Movement Prediction
Types of Candlestick Patterns
Candlestick patterns can be divided into 2 parts
- Bullish Pattern
- Bearish Pattern
Bullish Candlestick Patterns
This pattern indicates that following a stock price correction, the stock price will rebound and begin to trend upward. Traders typically utilize candlestick patterns to enter a stock after it has shown an upward trend.
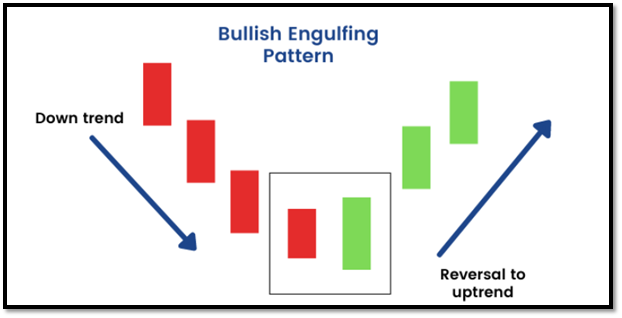
Bullish Engulfing Pattern
This candlestick pattern indicates the completion of a downward trend and a turnaround. It appears as two candles, the larger of which eats, the smaller bearish candle to become a bullish candle. It illustrates how momentum may shift from negative to positive.
Because the body of the bullish candlestick “engulfs” the entire body of the previous bearish candlestick, it is dubbed “engulfing”. This pattern is more likely to appear after a significant decrease in the stock price and when the stock is finding support at its crucial levels. A greater volume also implies that buyers are showing interest in the stock.
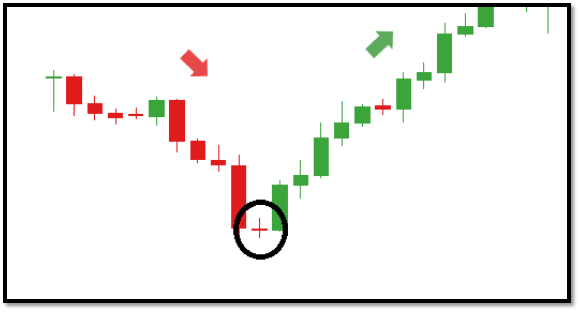
Morning Star Candlestick Pattern
Typically, this three-candle bullish pattern emerges toward the bottom of a downward trend. This pattern will show a lengthy bearish candle as the first candle, indicating that sellers have majority of the power over the stock, and a little body candle as the second candle, indicating that selling pressure may be easing. The last or third candle will be a lengthy bullish candle that closes above the middle of the first candle. This implies that buyers are trying to manipulate the price of the stock entirely. The size of the second small body candle boosts the pattern’s power. This pattern is more consistent when it proceeds in a long-term downward direction.
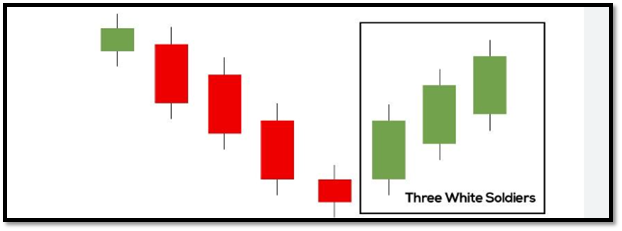
Three White Soldier
This bullish reversal candlestick pattern consists of three successive white or green candles. It usually happens close to the end of a declining trend and suggests an impending upward trend. All three white candles open higher than the previous day’s candle body and close at a higher price. All three candles should be free of an upper shadow, signifying continuous buying pressure. Every candle in the pattern should indicate a purchasing suggestion by having a body larger than the previous one. Through this pattern, it is thought that buyers are actively building momentum in the stock.
Bearish Candlestick Pattern
This pattern typically develops during an advance, when a stock hits its resistance level and the market has a correction in the price of the stock as a result of selling pressure or investor profit-booking.
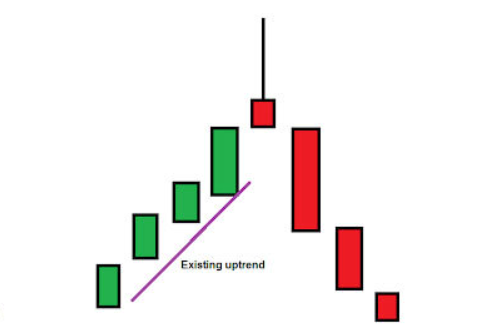
Hanging Man
This unique candlestick pattern usually appears following an upward trend. It is known as a bearish reversal pattern, indicating that an uptrend is likely to halt and a stock price correction is likely to occur. The candle appears hanging since its top portion is small, its bottom shadow is long, and it reaches beyond the light’s body. On the other hand, there are either very few or no shadows in the upper portion. It emerges following a robust ascent and a rise in sales volume.
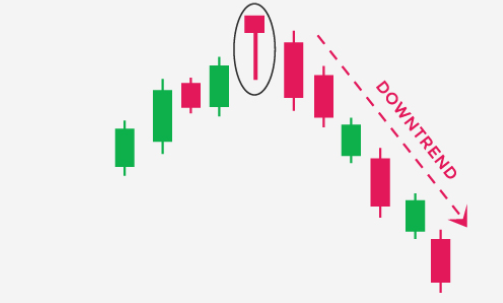
Shooting Star
The shooting star candlestick pattern, also known as the inverted hammer candlestick pattern, indicates that an upward trend in a stock is about to halt and a negative trend is about to begin. The lone candlestick in this pattern lacks a bottom shadow, albeit a small one is acceptable. It has a small body with a longer top shadow. This candle usually shows that sellers were applying pressure on the price, which prevented buyers from raising the price even if they tried.
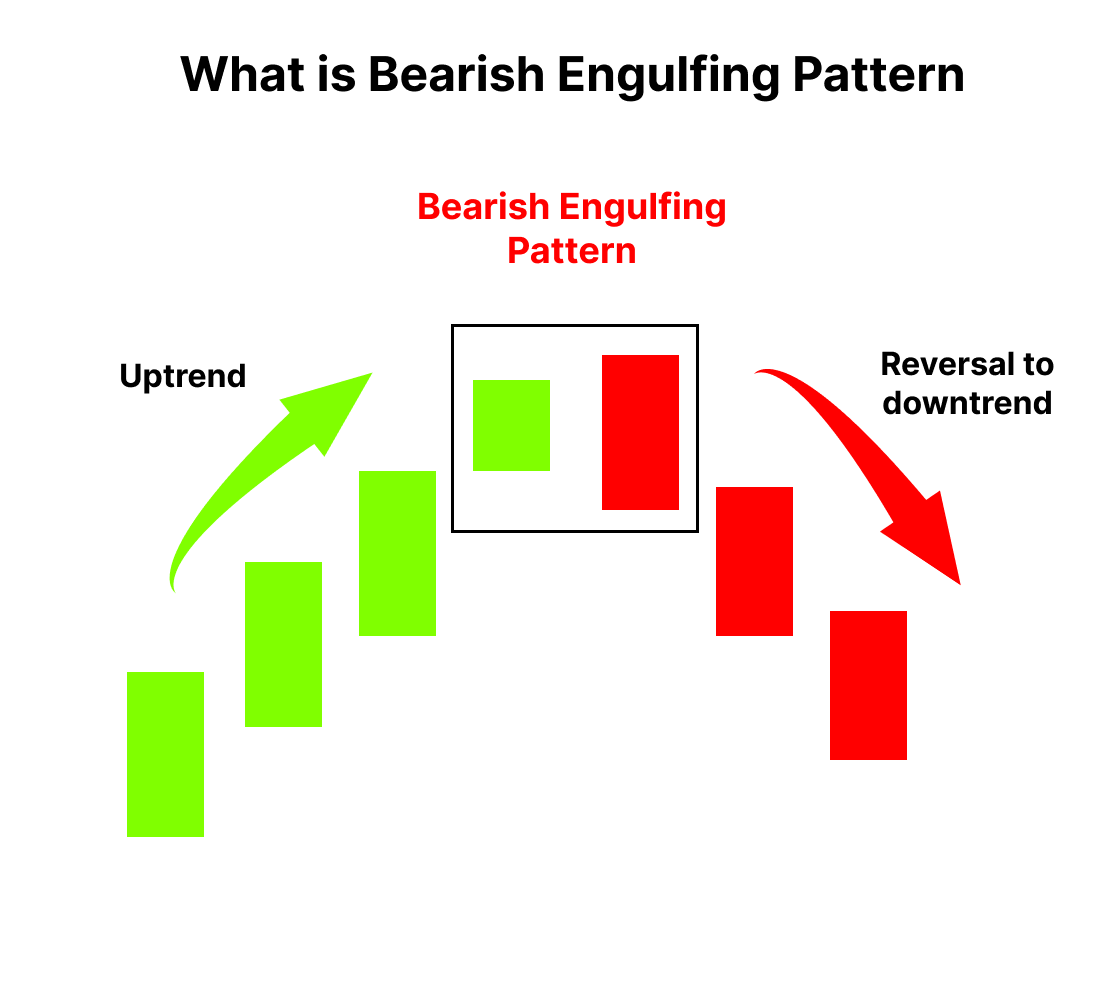
Bearish Engulfing
It is seen as a strong reversal signal, meaning that the current trend is set to halt and there may be further downward movement. This pattern also consists of two candlesticks; the first is green and has a little body. By encompassing the whole range of the previous day’s candle, the second candle opens above the close and closes below the open price. In order for the pattern to exist, there must be a significant difference in size between the first and second candles.
Read Also: Chart Patterns All Traders Should Know
Conclusion
The candlestick pattern is a valuable tool traders use to analyze market trends and forecast the direction of stock movement. But before making any investment, a trader needs to have a deeper comprehension of the candlestick patterns. Technical and fundamental analysis is also necessary to execute a good trade; thus, it’s important to realize that candlestick patterns are not always accurate.
Frequently Asked Questions (FAQs)
How do I use candlestick charts to make trading decisions?
A candlestick chart helps you identify the momentum and direction of the stock, which can help you make your investment decision. However, along with these charts, it is essential to use different technical tools and consider the overall market condition before executing any trade.
Why do candlesticks have different shapes and sizes?
The size of the candle changes with the price movement of the stock.
How can a beginner learn about the candlestick pattern?
A beginner’s first step is learning about the candlestick structure and identifying a few basic candlestick patterns. He can do this through books, online tutorials, educational videos, etc.
Who discovered the first candlestick pattern?
The candlestick pattern was first discovered by a rice trader in Japan, Homma Munesiha, in the 1700s.
What is a wick in a candlestick?
Wicks are shadows or lines that indicate where the price of a stock has fluctuated based on its opening and closing prices. A shadow represents the highest and lowest prices at which a security has been traded over time.
Disclaimer
The securities, funds, and strategies discussed in this blog are provided for informational purposes only. They do not represent endorsements or recommendations. Investors should conduct their own research and seek professional advice before making any investment decisions.