| Type | Description | Contributor | Date |
|---|---|---|---|
| Post created | Pocketful Team | Oct-14-24 |
Read Next![]()
- What Is Leverage in the Stock Market?
- Common Trading Mistakes Beginners Make (And How to Avoid Them)
- How to Pledge ETFs for Margin in India
- What Is Expiry Day Trading?
- Best ETF Platforms for Trading and Investment in India 2026
- What Is Strike Price in Options Trading?
- What is Speculative Trading?
- What is Revenge Trading?
- What Is Time Decay in Options?
- What are Candlestick Patterns? 38 Candlestick Patterns Every Trader Must Know
- How to Read Stock Charts: A Beginner’s Guide to Chart Analysis
- What is Gold Trading?
- Top Algo Trading Programming Languages in 2026
- What is Short-Term Trading Vs Long-Term Trading Strategies?
- NSE Algo Trading Rules for Retail Traders in India
- What is a Harami Candlestick Pattern?
- What is Average Traded Price in Stock Market
- What is MIS in Share Market?
- 7 Common Mistakes in Commodity Trading New Traders Must Avoid
- Brokerage Charges in India: Explained
Bearish Doji Star Pattern
Written by : Pocketful Team
|Updated by : Pocketful Team
Published on : 14th October 2024
|Updated on : 24th January 2025
Candlestick patterns in technical analysis provide important insights into market sentiment and possible price changes. Every trader wants to exit long positions and book profits before the bears arrive. The Bearish Doji Star is one such pattern that may indicate an impending bearish reversal.
In this blog, we will examine the Bearish Doji Star candlestick pattern, its key features, advantages and limitations. Moreover, we will look at an example to better understand the trading setup for this pattern.
What is the Bearish Doji Star Pattern?
The Bearish Doji star is a candlestick pattern used in technical analysis to signal a possible shift from bullish to bearish momentum. This candlestick pattern usually appears after a bullish trend, signaling that buyers may be losing control and sellers are gaining power.
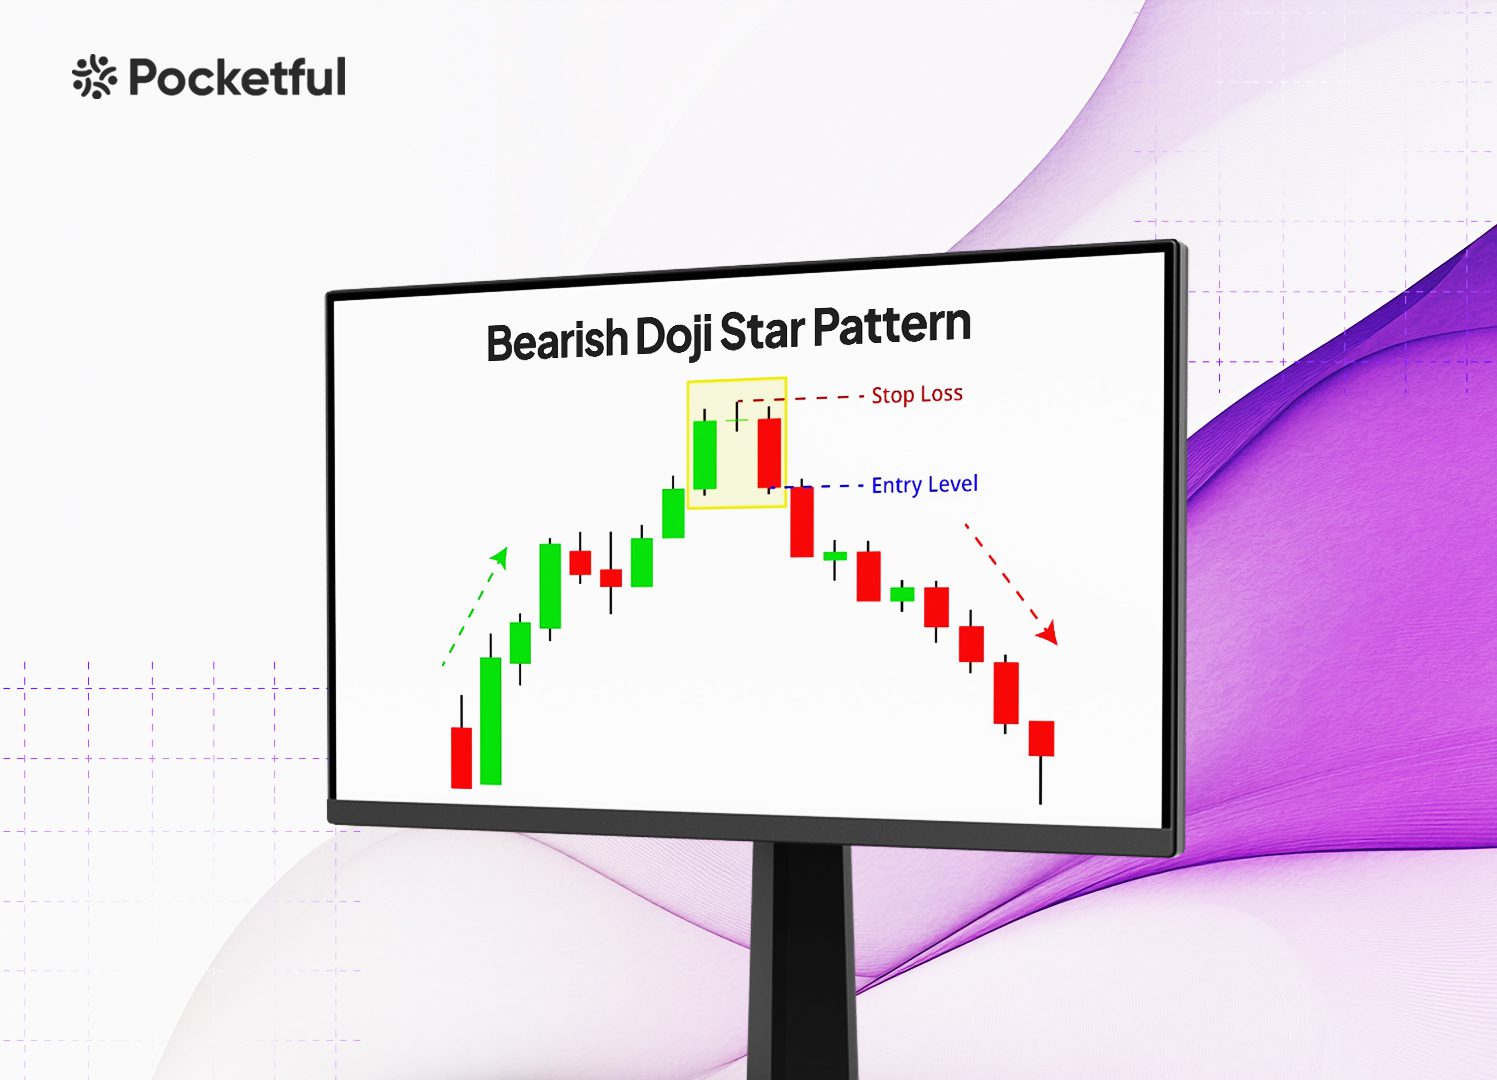
The Bearish Doji Star pattern consists of two candlesticks:
- The first candle is bullish and indicates that buyers are trying to push the market prices higher.
- The second candle is a Doji candle, which indicates indecision in the market.
A bearish candle, often a long red one, follows the Doji candle, confirming the bearish reversal signal. This bearish candle should close below the low of the Doji candle. The pattern interpretation is given below.
- Interpretation: This pattern shows a change in market sentiment. A Doji candle after a bullish trend shows uncertainty, while a following bearish candle indicates aggressive selling. Traders view this pattern as a warning that upward momentum might be fading, signaling a possible downward trend.
How to Determine Entry, Target & Stop-Loss Levels?
An individual can follow the below-mentioned trading setup to determine entry, target and stop-loss levels:
- Entry: You can wait for a big bearish candle after the formation of the pattern and then create a short position in the market.
- Target: Traders can find swing lows or significant support zones on the chart and use them as target levels to book profits.
- Stop-Loss: One of the most effective strategies is to place the stop-loss just above the high of the Doji candle. Since the Doji represents indecision and a possible reversal, the market is unlikely to climb above this level if the bearish reversal signal is genuine.
You should at least have a risk-to-reward ratio of 2:1, which means if the potential loss is, say, INR 500, then you should put your target up at INR 1000. So, even if half of the trades do not pay off, every winning trade will still be more than compensating for any losses.
Read Also: Morning Doji Star Candlestick Pattern
Example of Bearish Doji Star Pattern for Bank of India
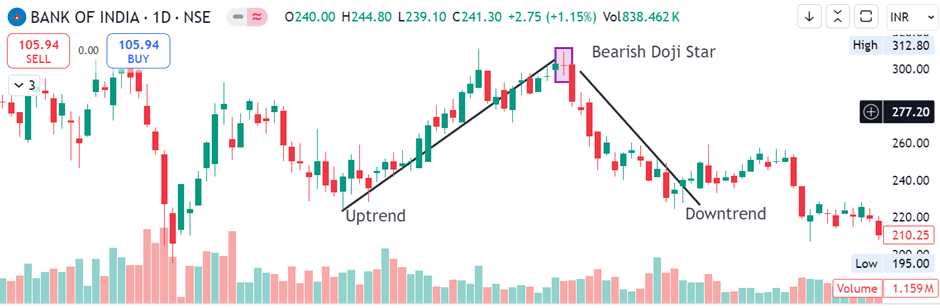
The image above shows the Bearish Doji Star pattern on the price chart of the Bank of India. We can see that the stock was in an uptrend, after which the stock price formed a Bearish Doji Star pattern. Furthermore, the pattern appears near a major support level of INR 310. After the confirmation from the big bearish candle after the pattern, traders can create a short position, and from the chart, it is clear that the sellers were in control, and the stock price made a low of INR 230 in the coming days.
Advantages of the Bearish Doji Star Pattern
The advantages of the Bearish Doji Star pattern are:
- This pattern signals a possible shift from a bullish to a bearish trend. This allows traders to prepare for a downturn and make better trading decisions.
- The Doji candle in this pattern indicates a state of indecision, followed by a bearish candle that confirms a definitive shift in momentum from buyers to sellers. This simplifies the understanding of changes in market sentiment.
- The pattern is easy to spot on a chart, making it useful for both beginner and experienced traders.
- The pattern works efficiently across different time frames, such as daily, weekly, and monthly. This makes it useful for short-term traders, swing traders and long-term investors.
Limitations of the Bearish Doji Star Pattern
The limitations of the Bearish Doji Star pattern are:
- Bearish Doji Star pattern can generate false signals in sideways or choppy markets.
- Traders must use a little bit of judgment when it comes to a Doji Candle. Determining a candle as Doji requires a little subjectivity to decide if the open and close prices are the same or not.
- A Bearish Doji Star pattern can be followed by a minor pullback or consolidation instead of a quick bearish trend. Traders should carefully analyze the overall market landscape to prevent exiting short positions too early.
- A Bearish Doji Star pattern may not lead to significant price movements in markets with low liquidity, making trading opportunities less appealing.
Read Also: Bullish Doji Star Pattern
Conclusion
The Bearish Doji Star is an essential candlestick pattern for traders aiming to spot possible reversal from bullish to bearish. This indicates a change in the market sentiment, starting with a Doji candle that shows uncertainty, followed by a bearish confirmation candle that confirms the reversal. The main insight here is that the pattern suggests a potential waning of bullish momentum and the emergence of seller dominance. This presents a valuable opportunity to consider creating short positions or closing out long ones. It is advisable to consult a financial advisor before trading.
Frequently Asked Questions (FAQs)
01
When should I create a short position immediately after the Doji candle forms?
One should wait for the bearish candle to close below the low of the Doji candle before creating a short position.
02
Does the Bearish Doji Star pattern always give a strong trend reversal signal?
The Bearish Doji Star pattern can fail like any other pattern, and it may signal a minor pullback in strong uptrends, so other indicators should be used to confirm the strength of the reversal signal.
03
What timeframe is best for using the Bearish Doji Star pattern?
The Bearish Doji star can appear in any timeframe but is more reliable in longer timeframes, such as daily or weekly charts.
04
Should I use the Bearish Doji star alone?
Combining the Bearish Doji Star pattern with other technical analysis tools, like support/resistance levels, RSI, MACD, or moving averages, is recommended for better accuracy.
05
What is the difference between a Bearish Doji Star and a Shooting Star pattern?
Both patterns have Doji candles with small bodies and long shadows, but the Doji candle in Shooting Star has a longer upper shadow than the Doji candle in the Bearish Doji Star pattern.
Disclaimer
The securities, funds, and strategies discussed in this blog are provided for informational purposes only. They do not represent endorsements or recommendations. Investors should conduct their own research and seek professional advice before making any investment decisions.
