| Type | Description | Contributor | Date |
|---|---|---|---|
| Post created | Pocketful Team | Dec-10-24 |

- Blog
- trading
- candlestick patterns
- black candle
Black Candle Pattern

Candlestick patterns play a key role in technical analysis. They offer market insights and help investors predict possible price movements. The Black Candle stands out as a strong sign of bearish momentum. Getting to know the Black Candle and its significance can enhance your trading decisions, no matter if you’re new to trading or have been at it for years.
This blog post breaks down what a Black Candle is, how to interpret it, and how to fit it into your trading plan. We’ll share the advantages and disadvantages of using this pattern.
What is the Black Candle Pattern?
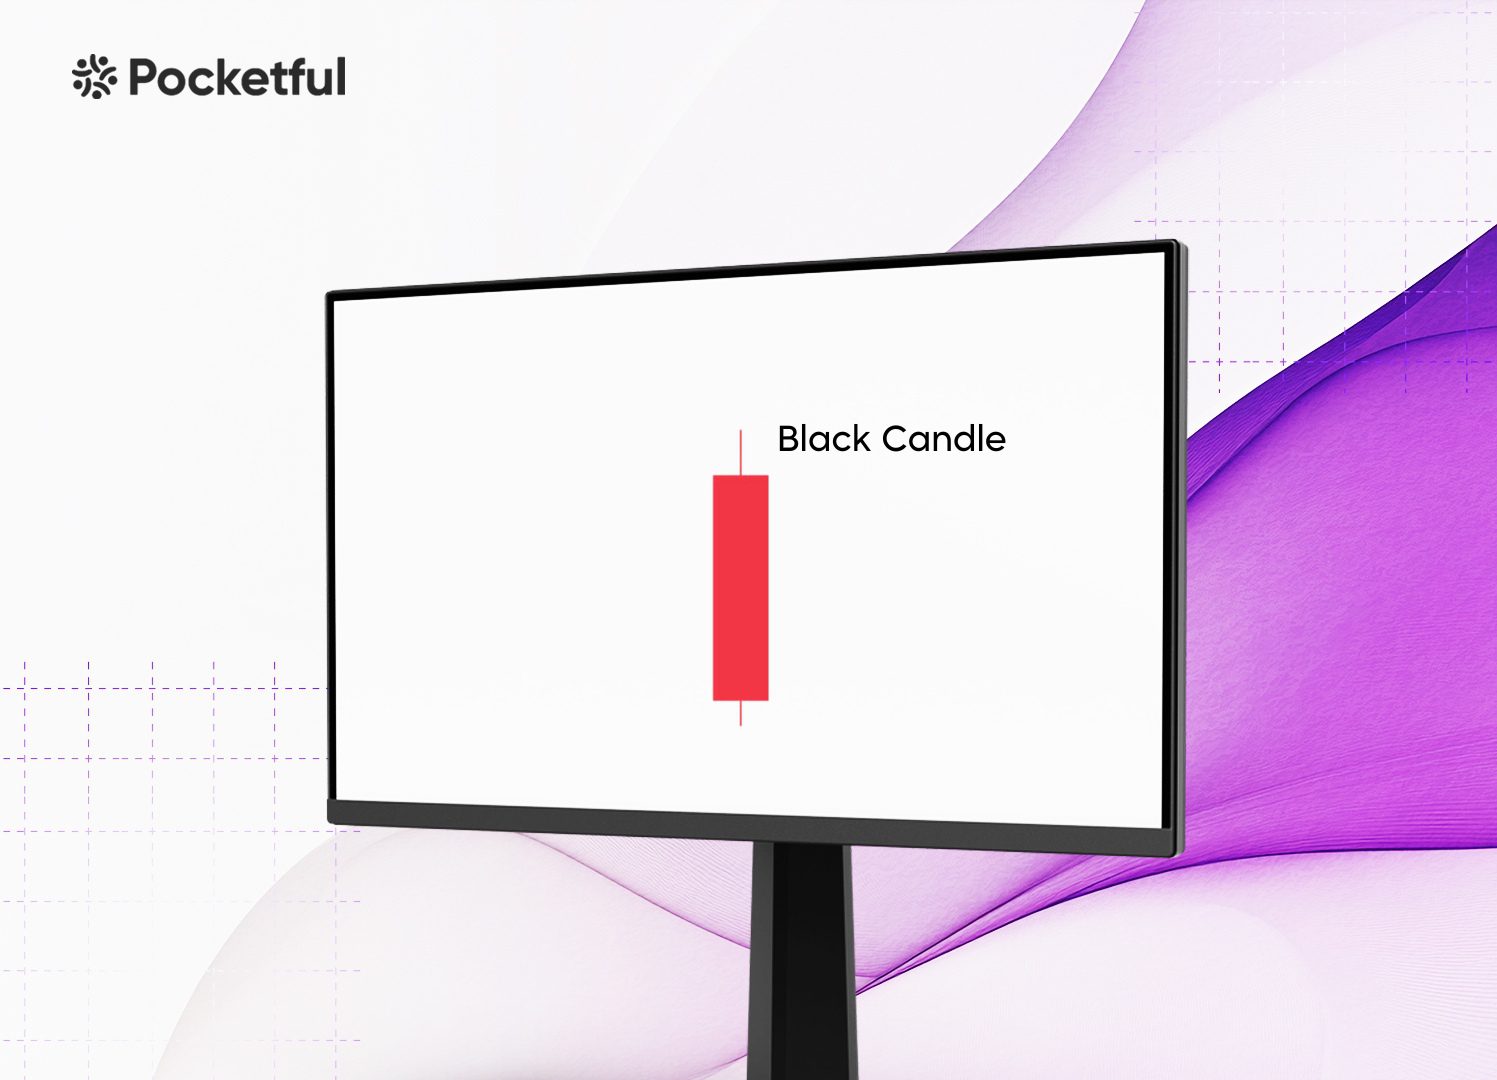
The Black Candle pattern is a single candlestick pattern in technical analysis commonly found in stock, forex, or cryptocurrency charts. It is a bearish candlestick pattern that shows selling pressure or a price decline during the trading session.
A black candle is formed when an asset price closes at a price lower than its opening price during a specific period. A long black body signifies strong downward pressure on the asset price. A small or no upper shadow indicates minimal resistance to selling pressure. A small or absent lower shadow indicates weak buying support.
Interpretation
A long black candle is usually seen as a bearish signal. Sellers seem to be in control, and prices might keep falling. The size of the black candle indicates the strength of the selling pressure. A larger black candle suggests stronger selling pressure. It is best to wait for confirmation from other indicators before creating short positions based on just one black candle.
How to Determine Entry, Target & Stop-Loss?
Entry: You can create a short position once a long black candle is formed. For better accuracy, you can wait for confirmation from other indicators, volume analysis, etc.
Stop-Loss: Setting an appropriate stop-loss is essential for managing risk when trading a Black Candle pattern. Three ways to determine the stop-loss are:
- It is simple to set your stop-loss just above the highest point of the black candle.
- If a black candle appears near a resistance level, place the stop-loss just above that level.
- Choose your preferred risk-reward ratio, like 1:2 or 1:3, and set your stop-loss accordingly.
Target: You can set the target in the following ways:
- Identify a nearby support zone as the initial target.
- You can also use Fibonacci Extensions to determine your desired target.
- A black candle occurring with a higher volume makes it more reliable, and you can aim for big price moves based on it. However, a weak volume suggests the bearish move lacks strength, so set targets conservatively.
Example of Black Candle Pattern

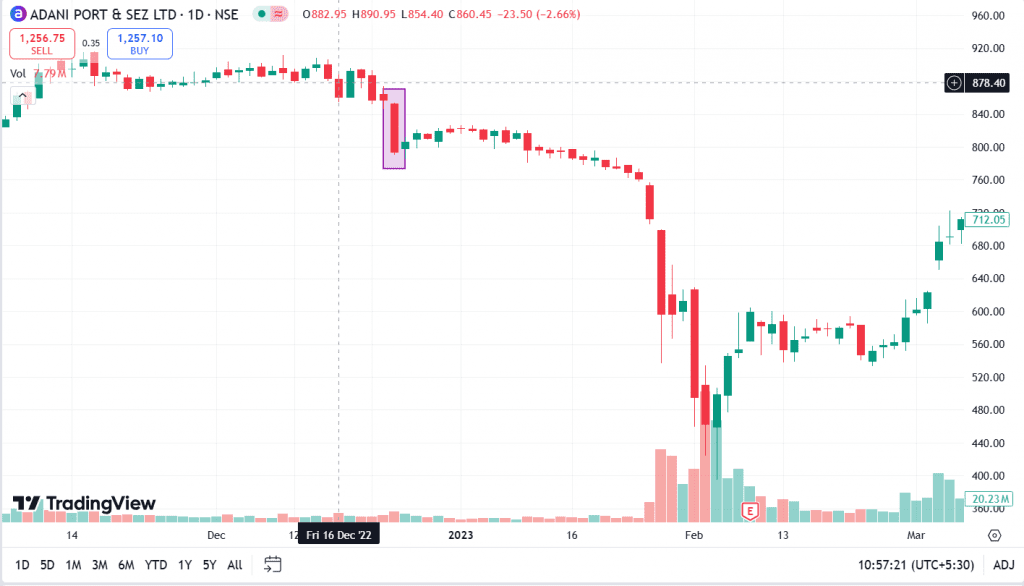
The chart above shows a clear formation of a Black Candle or red candle on the daily timeframe of Adani Ports & SEZ Ltd. The stock made a big black candle or red candle on 23 December 2022 and fell from ₹853 to ₹794. A breakout can be seen after a significant phase of consolidation, which is further followed by a downtrend and the stock closed at ₹495 on 1 February 2023.
Read Also: Closing Black Marubozu Candle
Advantages of Black Candle Pattern
The advantages of using the Black Candle pattern are:
- Gives Reversal Signal: This pattern signals a possible shift from a bullish to a bearish trend. This allows traders to prepare for a downturn and create bearish positions.
- Easy to spot: The pattern is easy to identify on a chart, making it accessible for both beginner and experienced traders.
- Versatile: This pattern is versatile and is effective across various time frames, including daily, weekly, and monthly charts, making it suitable for short-term traders, swing traders and long-term investors alike.
- Volume Confirmation: A black candle with a high trading volume indicates strong bearish sentiment.
Limitations of Black Candle Pattern
The limitations of using the Black Candle pattern are:
- False Signals: In a sideways or choppy market, the black candle can give false signals, which can result in losses.
- Limited Profit Opportunities: In markets with low liquidity, a black candle pattern may not lead to significant price movements, making profit opportunities less appealing.
- Lagging Indicator: When a black candle appears, chances are likely that a significant bearish price movement may have already happened, thus eliminating chances for early entry and reduced profit potential.
- No guarantee of Trend Continuation: A black candle pattern is not 100% accurate in predicting a downtrend as market conditions can change rapidly.
Read Also: Black Marubozu Candlestick Pattern
Conclusion
The Black Candle pattern is a useful candlestick pattern in technical analysis as it helps you identify bearish market sentiment. Its simplicity and usefulness make it a popular tool for spotting possible downtrends. Nonetheless, similar to any pattern, its accuracy depends upon the appropriate context and validation through additional indicators, support and resistance levels, etc. The black candle offers useful insights but should not be used alone because it can give false signals and can result in losses. Traders can enhance their chances of success by incorporating it into a broader trading strategy that accounts for volume, trend direction and market context. It is advised to consult a financial advisor before trading.
Frequently Asked Questions (FAQs)
Does a Black Candle pattern always suggest a downtrend?
The accuracy of the Black Candle pattern depends on the broader market context, such as existing trends, support/resistance levels, etc.
What is the difference between the black candle and the red candle?
Both the candles signify bearish momentums. You can change the color of the candles according to your preference.
Can a black candle occur in an uptrend?
Yes, it can signify a possible reversal or temporary pullback within an uptrend.
Which patterns often include black candles?
Patterns like bearish engulfing, dark cloud cover, and three black crows often feature black candles.
Can black candles appear in the sideways market?
Yes, they can appear but may not have much significance in choppy or range-bound markets.
Disclaimer
The securities, funds, and strategies discussed in this blog are provided for informational purposes only. They do not represent endorsements or recommendations. Investors should conduct their own research and seek professional advice before making any investment decisions.