
| Type | Description | Contributor | Date |
|---|---|---|---|
| Post created | Pocketful Team | Jan-30-25 |
Read Next![]()
- Top 10 Intraday Trading Strategies & Tips for Beginners
- How to Use Pivot Points in Intraday Trading?
- What is Intraday Trading?
- Understanding Intraday Trading Timings
- How to Choose Stocks for Intraday the Right Way?
- Market Order Vs Limit Order: What’s the Difference?
- Silver Futures Trading – Meaning, Benefits and Risks
- What is Crude Oil Trading and How Does it Work?
- Top Algorithmic Trading Strategies of 2025
- What is Paper Gold? – Meaning, Types, & Benefits
- What is Algo Trading?
- What is Tick Trading? Meaning & How Does it Work?
- Rising Window Candlestick Pattern
- Black Candle Pattern
- Piercing Pattern
- High-Wave Candlestick Chart Pattern
- Closing Black Marubozu Candle
- What is the Best Time Frame for Swing Trading?
- Downside Tasuki Gap Candlestick Pattern
- Bullish Belt Hold Pattern

- Blog
- trading
- candlestick patterns
- blending
Blending Candlestick Patterns: How It Works, Benefits & Drawbacks
|
|
Understanding candlestick patterns includes much more than memorizing and identifying specific formations. It involves understanding market psychology and the dynamics of supply and demand that these patterns represent. For decades, many books have been written about candlestick patterns containing hundreds of different formations that supposedly provide inside information about what is coming next.
In this blog, we will learn about blending candlesticks and its advantages and disadvantages.
What are Blending Candlesticks?
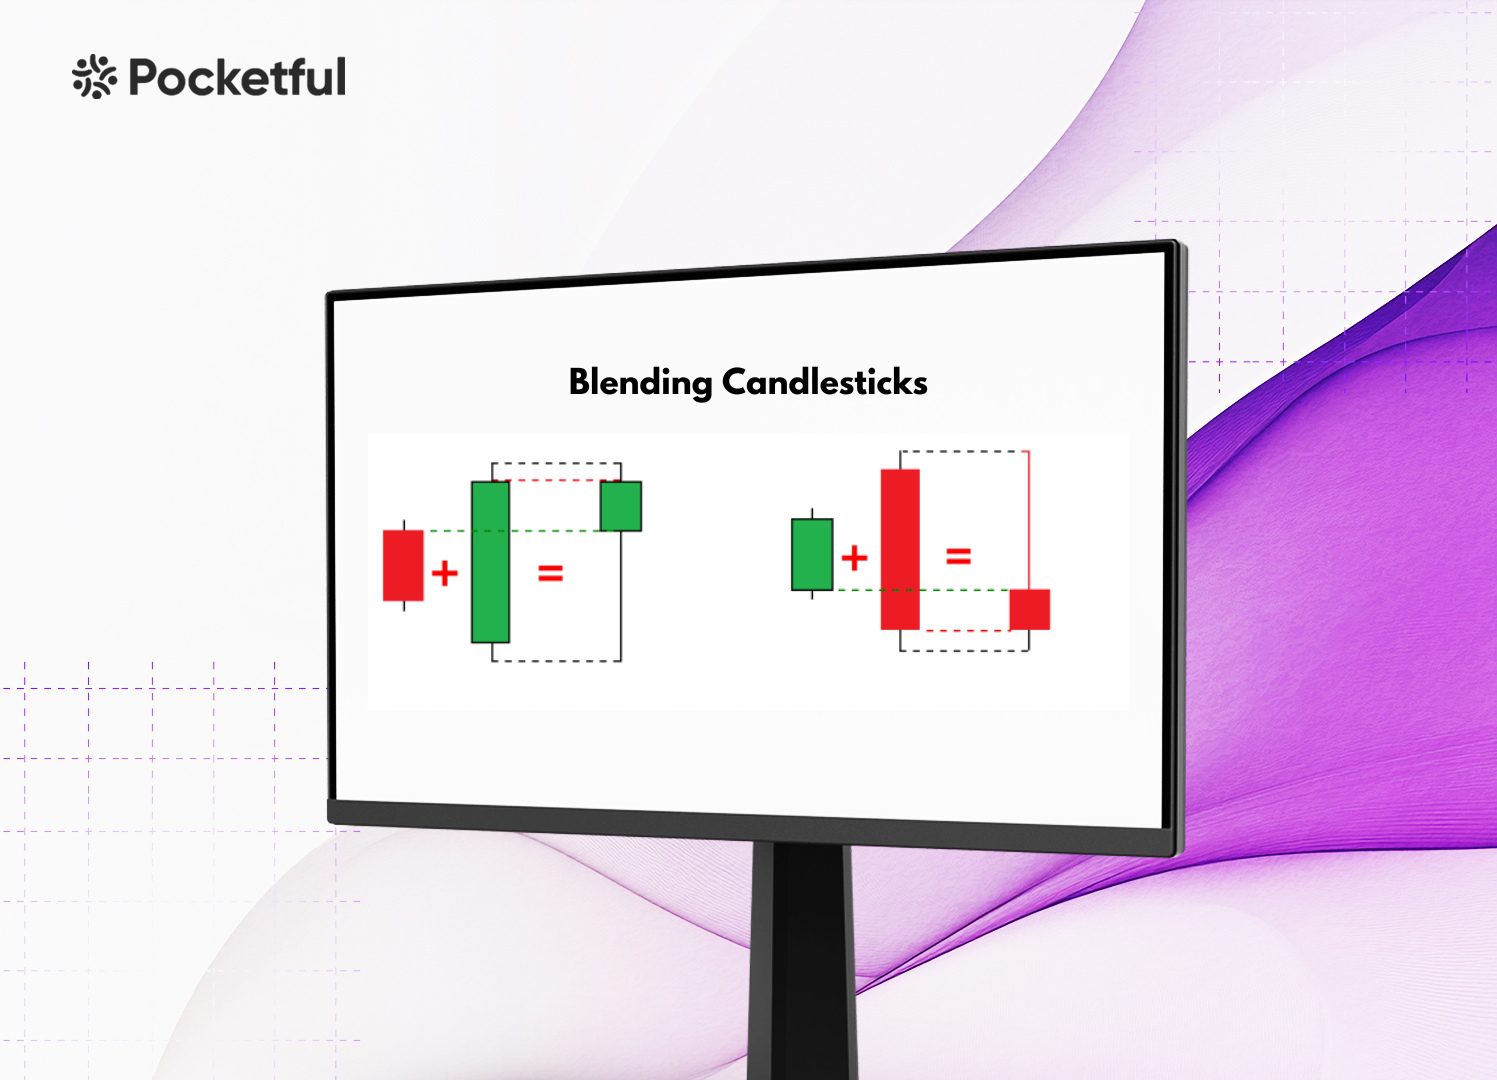
Blending candlesticks is a technical analysis technique that combines multiple candlesticks into one to simplify and analyze chart patterns. The goal is to recognize patterns in price movements across several trading sessions by creating a combined candlestick.
How Does Blended Candlestick Work?
Blending is done by combining the Open, High, Low, and Close (OHLC) values of the chosen candlesticks into one. The blended candlestick has the following OHLC values:
1. Open Price: The blended candlestick’s open price is the lowest of all the opening prices of the selected candlesticks if the blended candlestick is bullish. On the other hand, the blended candlestick’s open price is the highest of all the opening prices of the selected candlesticks if the blended candlestick is bearish.
2. High Price: The highest of all the high prices of the selected candlesticks is the high of the blended candlestick.
3. Low Price: The lowest of all the low prices of the selected candlesticks is the low for the blended candlestick.
4. Close Price: The blended candlestick’s close price is the highest of all the closing prices of the selected candlesticks if the blended candlestick is bullish. On the other hand, the blended candlestick’s close price is the lowest of all the closing prices of the selected candlesticks if the blended candlestick is bearish.
Let us understand this with an example,
Day 1
- Open Price: INR 100,
- High Price: INR 110,
- Low Price: INR 95
- Close Price: INR 105
Day 2
- Open Price: INR 105,
- High Price: INR 112,
- Low Price: INR 102;
- Close Price: INR 108
Both candles are bullish and combine to form a bullish blended candlestick. So, the blended candlestick would have the following values:
- Open Price: INR 100 (Open of Day 1)
- High Price: INR 112 ( Highest price of Day 1 and Day 2)
- Low Price: INR 95 (Lowest price of Day 1 and Day 2)
- Close Price: INR 108 (Close Price of Day 2)
Read Also: Bullish Harami Candlestick Pattern
Why Blend Candlesticks?
Blending candlesticks simplifies analysis by uncovering trends and patterns that may be less apparent in individual candlesticks. Some of the key reasons for blending candlesticks are listed below;
1. To Identify Long-term Trends: Combining multiple candlesticks into one helps traders see the overall trend over longer periods. For instance, traders can analyze weekly candlesticks made from daily data to determine if the market is bullish, bearish, or consolidating.
2. To Simplify the Complex Patterns: Blending can make complex candlestick patterns easy and simple. Combining multiple candlesticks into one reveals patterns, helping traders make better trading decisions.
3. To Analyze Momentum & Reversals: A blended candle can provide more insight into price momentum or possible reversals than multiple individual candlesticks over time.
4. To Detect fake Breakouts or Continuations: Short-term breakouts or pullbacks can confuse traders. Blending candlesticks can help determine if market movements are valid or just a part of a larger trend.
Target & Stop Loss for Blended Candlestick
You can follow the following steps to set target and stop-loss for a blended candlestick:
Setting the Stop Loss
- Place the stop loss below the low of the blended candle if you expect a bullish movement.
- Place the stop loss above the high of the blended candle if you expect a bearish movement.
- You can place the stop-loss slightly below the support or above the resistance zones if you expect consolidation.
Setting the Targets
- You can define the targets by using risk-to-reward ratios. Common ratios used are 1:2 or 1:3, which means that for every ₹1 of risk, you are getting a profit of ₹2 & ₹3, respectively.
- Furthermore, you can also recognize the recent highs/lows or strong support and resistance to determine targets.
Advantages of Blended Candlestick
- Simplifies Trend Analysis: Blending multiple candlesticks helps traders focus on the bigger picture by reducing noise and recognizing trends, specifically on higher time frames.
- Easy Pattern Recognition: Certain multi-candlestick patterns, such as Engulfing, Morning Star, etc., are difficult to identify but become evident when multiple candlesticks are combined.
- Reduces Market Noise: Short-term fluctuations, like wicks and minor pullbacks, can be distracting. Blended candlesticks only consider important price points across multiple candlesticks.
Disadvantages of Blended Candlestick
- Minor Details: Blending candlesticks overlook important short-term price details that are important for scalpers as well as day traders.
- Risk of False Interpretations: Traders use varying numbers of candlesticks, resulting in different interpretations of trends and patterns.
- May not Work in All Market Conditions: Blending is effective in trending markets but can be confusing in sideways markets where price moves within a range.
- Delayed Signals for Entry/Exit: Blending gives a wider perspective, causing a slight delay for traders to enter trades than those using shorter timeframes with raw candlestick data.
Example
Engulfing patterns consist of two candles, i.e., a smaller one followed by a larger opposite candle that completely covers the first candle. However, the second candle might not be enough to completely engulf the previous candle and may combine with the third candle to completely form the engulfing pattern.
Read Also: Two-Candle Shooting Star
Conclusion
Blending candlestick patterns is an advanced and effective way to improvise technical analysis. Combining multiple candles helps traders reduce noise, uncover market sentiment, and make better trading decisions. These patterns can improve your ability to identify trends and reversals in forex, stocks and other financial instruments. Whether you are a swing trader, day trader, or long-term investor, blending candlesticks can help you capitalize on hidden market opportunities.
| S.NO. | Check Out These Interesting Posts You Might Enjoy! |
|---|---|
| 1 | Three-Line Patterns |
| 2 | Bearish Engulfing Pattern |
| 3 | Rising Window Candlestick Pattern |
| 4 | Black Candle Pattern |
| 5 | High-Wave Candlestick Chart Pattern |
Frequently Asked Questions (FAQs)
Do professional traders use blending?
Yes, swing traders and long-term investors often blend candlesticks to focus on broader trends.
Does blending work on all timeframes?
Yes, but it is most useful on higher timeframes like daily, weekly, or monthly charts.
Does blending affect reversal patterns?
Blending candlesticks can make it easy to spot reversal patterns, and you can take advantage of the trading opportunities.
Can blended candlesticks change trading decisions?
Combining candlesticks can result in different patterns and trends that individual candles may not show, which can have a significant impact on trading decisions and profits.
Why do we need to blend candlesticks?
We need to blend a candlestick to remove noise, identify trends more easily, and make informed trading decisions based on long-term trends.
Disclaimer
The securities, funds, and strategies discussed in this blog are provided for informational purposes only. They do not represent endorsements or recommendations. Investors should conduct their own research and seek professional advice before making any investment decisions.