| Type | Description | Contributor | Date |
|---|---|---|---|
| Post created | Pocketful Team | Nov-21-24 |

- Blog
- trading
- candlestick patterns
- bullish belt hold
Bullish Belt Hold Pattern

Imagine you are closely monitoring the charts of a stock that has been in a downtrend for several days. Every attempt to rebound appears weaker, and the downtrend shows no signs of weakening. Suddenly, one candlestick draws your attention: a big green candle that closes near its high, standing out against the bearish backdrop. Could this be the reversal sign you’ve been waiting for?
In this blog, we will introduce you to the Bullish Belt Hold Pattern, a simple yet impactful single candlestick pattern that may suggest the initial phase of a bullish trend reversal. We will learn about its advantages, disadvantages and steps for setting entry, targets, stop-loss, etc.
What is the Bullish Belt Hold Pattern?
The Bullish Belt Hold is a single candlestick pattern indicating a possible reversal of a downtrend. This pattern, rooted in the Japanese candlestick charting methodology, is used by technical analysts to spot changes in market sentiment.
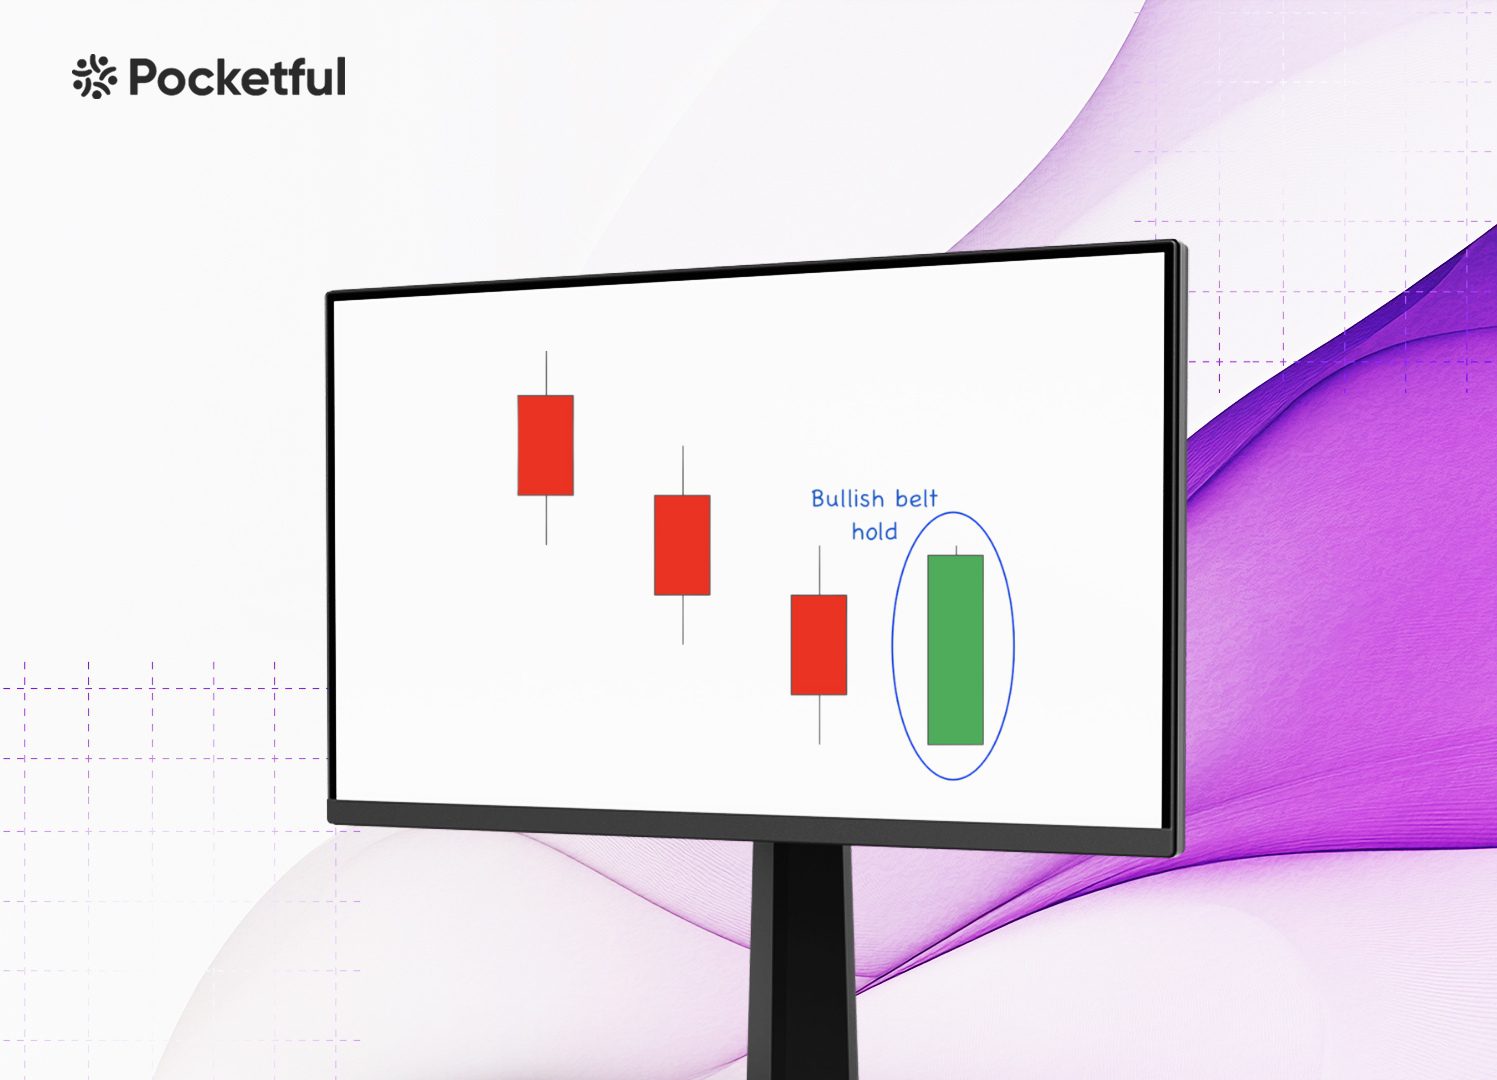
The Bullish Belt Hold pattern consists of a long green candlestick with minimal or no lower shadow. The candlestick opens near its low and then closes much higher, slightly below the high of the trading session. The pattern usually forms at the bottom of a downtrend, indicating a possible shift to bullish sentiment. The candlestick has a non-existent lower shadow and a short upper shadow.
The Bullish Belt Hold pattern shows that while sellers may initially drive prices down, buyers promptly intervene, resulting in a significant price surge and a closing near the peak. The change from negative to positive sentiment may signal the onset of an uptrend.
Additionally, traders often look for validation from subsequent candles. A bullish candlestick after the formation of the Bullish Belt Hold pattern reinforces confidence in the bullish reversal.
How to Determine Target and Stop-Loss?
An individual can follow the below steps to determine price levels for entry, target and stop-loss:
- Entry: Enter a long position when the price closes above the high of the Bullish Belt Hold candlestick or after the formation of a confirming bullish candle. Even though the candle suggests a trend reversal, it is safer to wait for a second bullish candle to confirm the shift.
- Stop-loss: Set the stop-loss just below the lowest point of the Bullish Belt Hold candle for optimal protection against losses. This ensures that if the pattern gives false signals, your losses are limited. Also, allow a slight buffer of around 0.5% below the lowest point to avoid getting the stop-loss triggered due to minor price fluctuations.
- Target: The most common approach for determining targets involves measuring the size of the Bullish Belt Hold Candle (from open to close) and projecting this distance upwards from the closing price. For instance, if the pattern’s candle is of 10 points, you could aim for a target that is 10 points higher than your entry point.
Additionally, you can also identify the closest resistance level or recent high to use as a target point. When the price nears a strong resistance level, it is wise to take profits or keep a trailing stop-loss.
Read Also: Closing White Marubozu Pattern
Example of Bullish Belt Hold Pattern of Aarti Pharmalabs Ltd.

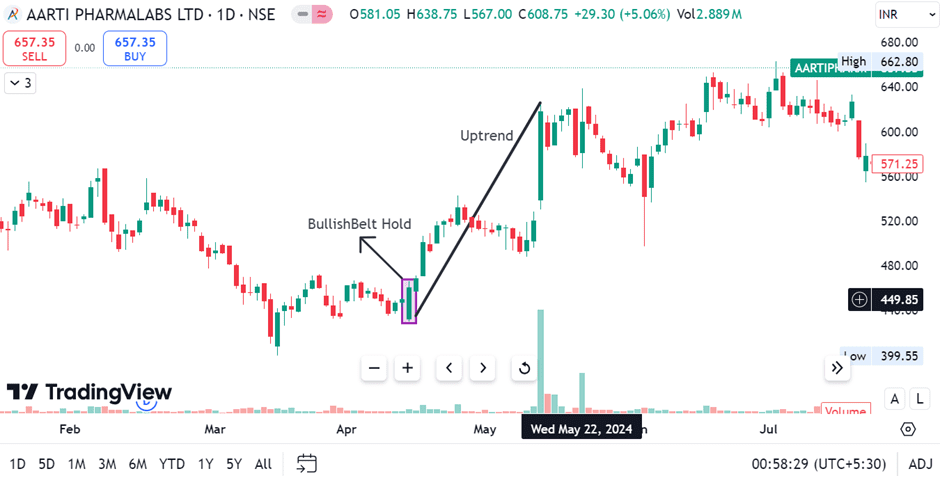
The image above shows the clear formation of the ‘Bullish Belt Hold’ pattern on the daily timeframe of Aarti Pharma Labs Limited, a manufacturer and seller of pharmaceutical and nutraceutical products. It can be seen that the pattern formed on 15 April 2024, and the stock’s closing price was INR 460. On 16 April 2024, the stock price increased to INR 468 and gave a breakout above the high of the pattern’s candlestick. The stock was in an uptrend and made a high of INR 515 on 25 April 2024.
Advantages of Bullish Belt Hold Pattern
The advantages of the Bullish Belt Hold pattern are:
- Clear Reversal Sign: The pattern signals a possible bullish reversal in a downtrend, making it easier for traders to identify a change in the market sentiment.
- Simple Pattern: Its distinct structure- a lack of lower shadow paired with a strong close near the high- makes it easy to identify for traders.
- Versatile across Multiple Time Frames: This pattern can be used on daily, hourly or minute charts, making it suitable for different trading styles, such as intraday and swing trading.
Limitations of Bullish Belt Hold Pattern
The limitations of the Bullish Belt Hold pattern are:
- Unreliable in Strong Downtrends: In a strong downtrend, a Bullish Belt Hold pattern may just represent a temporary pullback rather than a bullish reversal, leading to false signals.
- Single Candlestick Pattern: Though useful, the pattern lacks the contextual insights that multi-candle patterns offer, making it inherently riskier to depend on without further analysis or supportive indicators.
- Confirmation Needed: To enhance reliability, it is often necessary to seek confirmation from subsequent candles or indicators, but this can lead to delayed entry and diminished possible profits.
Read Also: Introduction to Bullish Candlestick Patterns: Implications and Price Movement Prediction
Conclusion
To summarise, the simple structure and ability to predict changes in market trends make the Bullish Belt Hold pattern a useful tool for traders. Despite its effectiveness, this single candle pattern does have its limitations, especially in volatile markets or strong downtrends. Hence, one should remember that the pattern can give false signals if used alone, so combining it with other indicators like resistance levels, trendlines, or volume analysis is best. Ultimately, understanding the context in which the ‘Bullish Belt Hold’ appears is important for making good trading decisions. By incorporating this pattern into a comprehensive analysis, traders can confidently navigate changing market dynamics.
Frequently Asked Questions (FAQs)
In what market conditions is the Bullish Hold most effective?
It is most effective in a downtrend.
Does the Bullish Belt Hold pattern work across all markets?
Yes, the pattern can be used to trade in different markets such as stocks, forex, commodities and currencies.
Should I wait for confirmation before taking a position based on the Bullish Belt Hold pattern?
Traders should wait for confirmation from other indicators to reduce the risk of false signals.
How does it differ from other bullish reversal patterns?
Unlike other bullish reversal patterns, the Bullish Belt Hold is a single-candle pattern that provides a quick reversal signal.
Is the Bullish Belt Hold pattern suitable for day trading?
Traders use the Bullish Belt Hold pattern for day trading and swing trading because of its reliable bullish reversal signal.
Disclaimer
The securities, funds, and strategies discussed in this blog are provided for informational purposes only. They do not represent endorsements or recommendations. Investors should conduct their own research and seek professional advice before making any investment decisions.