
| Type | Description | Contributor | Date |
|---|---|---|---|
| Post created | Pocketful Team | Oct-03-24 | |
| Add new links | Nisha | Mar-18-25 |
Read Next![]()
- MCX Trading: What is it? MCX Meaning, Features & More
- Top 10 Intraday Trading Strategies & Tips for Beginners
- How to Use Pivot Points in Intraday Trading?
- What is Intraday Trading?
- Understanding Intraday Trading Timings
- How to Choose Stocks for Intraday the Right Way?
- Blending Candlestick Patterns: How It Works, Benefits & Drawbacks
- Market Order Vs Limit Order: What’s the Difference?
- Silver Futures Trading – Meaning, Benefits and Risks
- What is Crude Oil Trading and How Does it Work?
- Top Algorithmic Trading Strategies of 2025
- What is Paper Gold? – Meaning, Types, & Benefits
- What is Algo Trading?
- What is Tick Trading? Meaning & How Does it Work?
- Rising Window Candlestick Pattern
- Black Candle Pattern
- Piercing Pattern
- High-Wave Candlestick Chart Pattern
- Closing Black Marubozu Candle
- What is the Best Time Frame for Swing Trading?

- Blog
- trading
- candlestick patterns
- bullish doji star
Bullish Doji Star Pattern
|
|
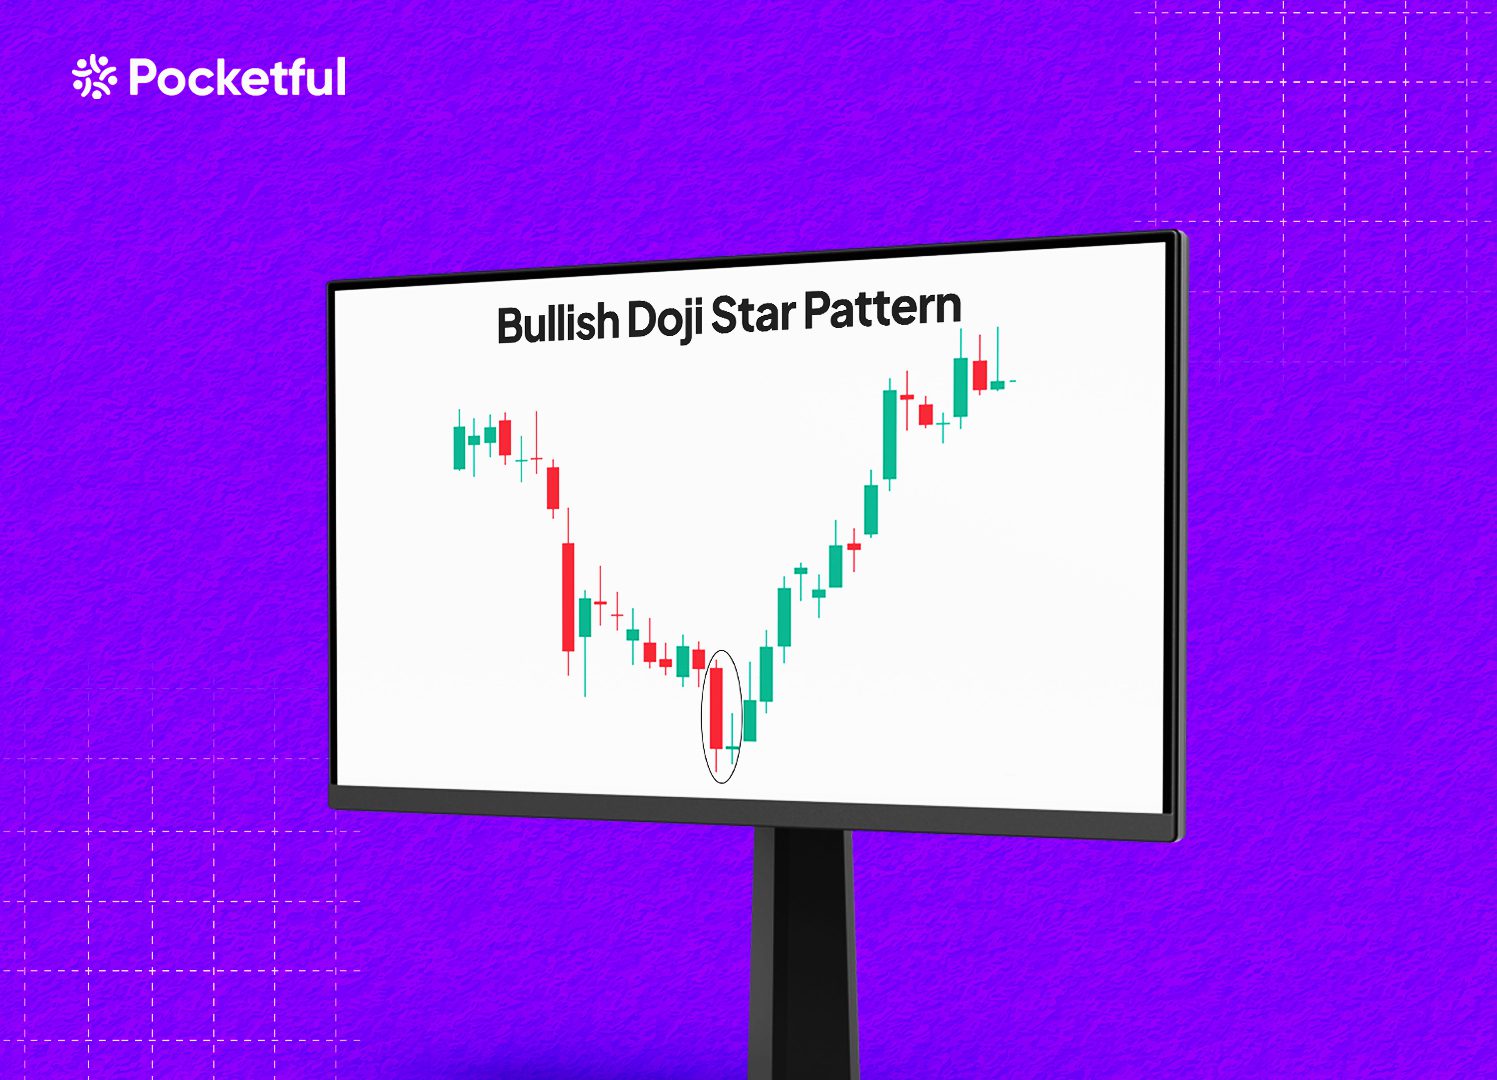
Are you eager to enhance your technical analysis skills? This candlestick pattern can assist you in recognizing possible trend reversals. This blog post will examine the Bullish Doji Star, including its components, trading implications, advantages, and limitations, along with a real-world example. Understanding this pattern can give both seasoned traders and beginners a good command of the financial markets.
What is the Bullish Doji Star Pattern?
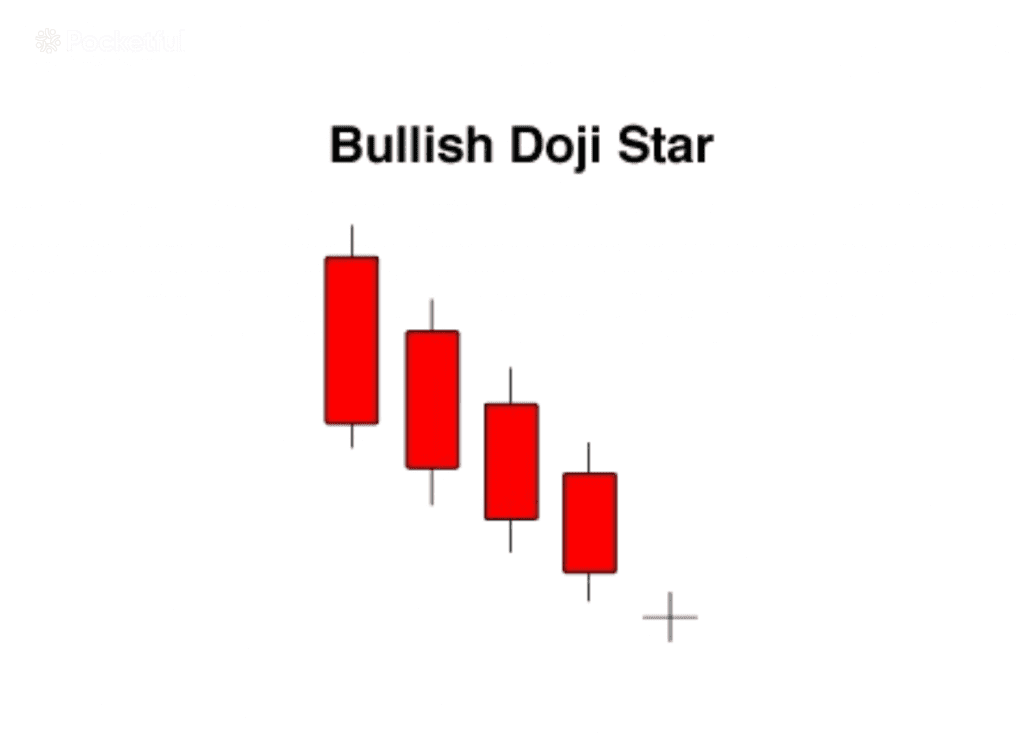
The Bullish Doji Star is a candlestick pattern indicating a possible bullish reversal from a downtrend. The pattern consists of two candlesticks and the market should be in a downtrend before the formation of the pattern. The traders need to observe certain criteria:
- A long red bearish candle shows a significant downtrend and highlights its intensity leading up to a possible reversal.
- A Doji candle featuring a small body indicates that the opening and closing prices are virtually identical. It shows uncertainty or a pause in the market.
How to Determine Target and Stop-Loss?
A simple method is to set a target just below the next resistance level. During a downtrend, previous highs can act as resistance following a market reversal.
An alternative approach is to establish the target price according to a predefined risk-reward ratio. For instance, traders pursue a risk-reward ratio of 1:2 or 1:3, which means that for every unit of risk assumed, the goal is to secure two or three times that amount in profit.
Setting a stop-loss is important for managing risks when trading a Bullish Doji Star pattern. A highly effective strategy involves positioning the stop-loss just beneath the low of the Doji candle. Traders sometimes set their stop-loss below a key support level. A drop below this level means the bullish reversal has failed, suggesting the downtrend will continue.
You can also trail the stop-loss as the asset price moves upwards. It will help you to secure profits as prices rise while also protecting against losses.
Read Also: Dragonfly Doji Pattern
Example of Bullish Doji Star of IRB Infra Dev Ltd.
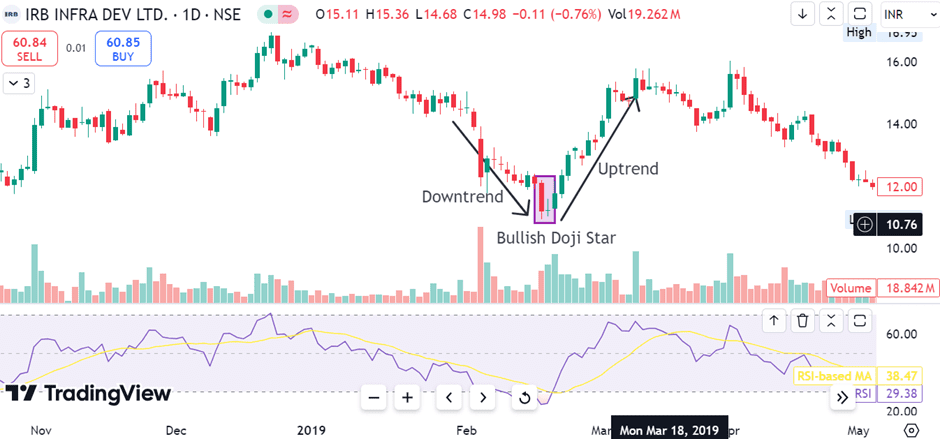
The chart above clearly shows the formation of the Bullish Doji Star pattern on the daily timeframe of IRB INFRA.
A long red candle is formed after a strong downtrend and is followed by a small green Doji candle. Afterwards, an uptrend can be seen.
Advantages of Bullish Doji Star Pattern
The advantages of the Bullish Doji Star Pattern are:
- The main benefit of Bullish Doji Star is its clear signal of a possible trend reversal. It helps traders choose the best point to enter long positions by identifying the shift from a downtrend to an uptrend.
- The pattern reveals the prevailing market sentiment. The initial bearish candle shows strong selling pressure, followed by indecision, and then a bullish candle confirms that buyers are in control. Recognizing this shift helps traders better understand market sentiment.
- It can be applied effectively in several market conditions and can be used across various timeframes, providing traders with valuable insights into possible reversals. This adaptability makes it a popular choice among both novice and experienced investors alike.
Limitations of Bullish Doji Star Pattern
The limitations of the Bullish Doji Star Pattern are:
- A major drawback of the Bullish Doji Star pattern is that it necessitates confirmation from the subsequent candlestick to validate its reliability. Any delay can lead to missed trading opportunities.
- Similar to many technical indicators, the Bullish Doji Star may not consistently provide reliable signals. It can give false signals, especially in highly volatile markets.
- The pattern needs confirmation, so it often lags behind the market. This lag can be especially problematic in volatile markets where conditions change rapidly. By the time the pattern plays out and a trader enters the market, much of the price movement may already have taken place, diminishing the profit.
Read Also: Long-Legged Doji Candlestick Pattern
Conclusion
The Bullish Doji Star is an effective pattern to identify possible reversal from a downtrend to an uptrend. Traders can increase their likelihood of executing successful trades by grasping the psychology behind market patterns, utilizing volume as a filter, and validating the patterns with the subsequent bullish candle. While technical patterns can be helpful, they are not always reliable. Traders should always use it alongside other tools and indicators to find a high-probability setup and manage risk effectively. It is advisable to consult a financial advisor before trading.
Frequently Asked Questions (FAQs)
What does the Doji candle represent?
The Doji candle represents market indecision, where the opening and closing prices are almost equal.
When should I enter a trade while using the Bullish Doji Star pattern?
A trader can create a long position after confirmation, such as the occurrence of a bullish candle, increased volumes, or using other technical indicators.
Can the Bullish Doji Star appear in any market?
Yes, the pattern works on different timeframes and various markets like stocks, forex, commodities etc.
Is the Bullish Doji Star pattern reliable?
The Bullish Doji Star pattern can be helpful while trading, but it is not completely reliable. Combining it with other technical analysis tools can improve its reliability.
Should I consult with a financial expert before trading a Bullish Doji Star pattern?
Yes, it is always suggested to consult with a financial expert before making any investment or trading decisions.
Disclaimer
The securities, funds, and strategies discussed in this blog are provided for informational purposes only. They do not represent endorsements or recommendations. Investors should conduct their own research and seek professional advice before making any investment decisions.