| Type | Description | Contributor | Date |
|---|---|---|---|
| Post created | Pocketful Team | Nov-20-24 |

- Blog
- trading
- candlestick patterns
- bullish harami
Bullish Harami Candlestick Pattern

There are several chart patterns that a trader can utilize to determine a stock’s trend. Suppose while searching for a trading opportunity, you find a stock that is steadily declining. Then suddenly, you notice a bullish candle out of nowhere, which suggests the stock price may be about to reverse. One such pattern is called the Bullish Harami candlestick pattern.
In this blog, we will describe the Bullish Harami candlestick pattern, its interpretation, advantages and limitations. We will also discuss the target and stop-loss levels traders should use while trading this pattern.
What is the Bullish Harami Candlestick Pattern?
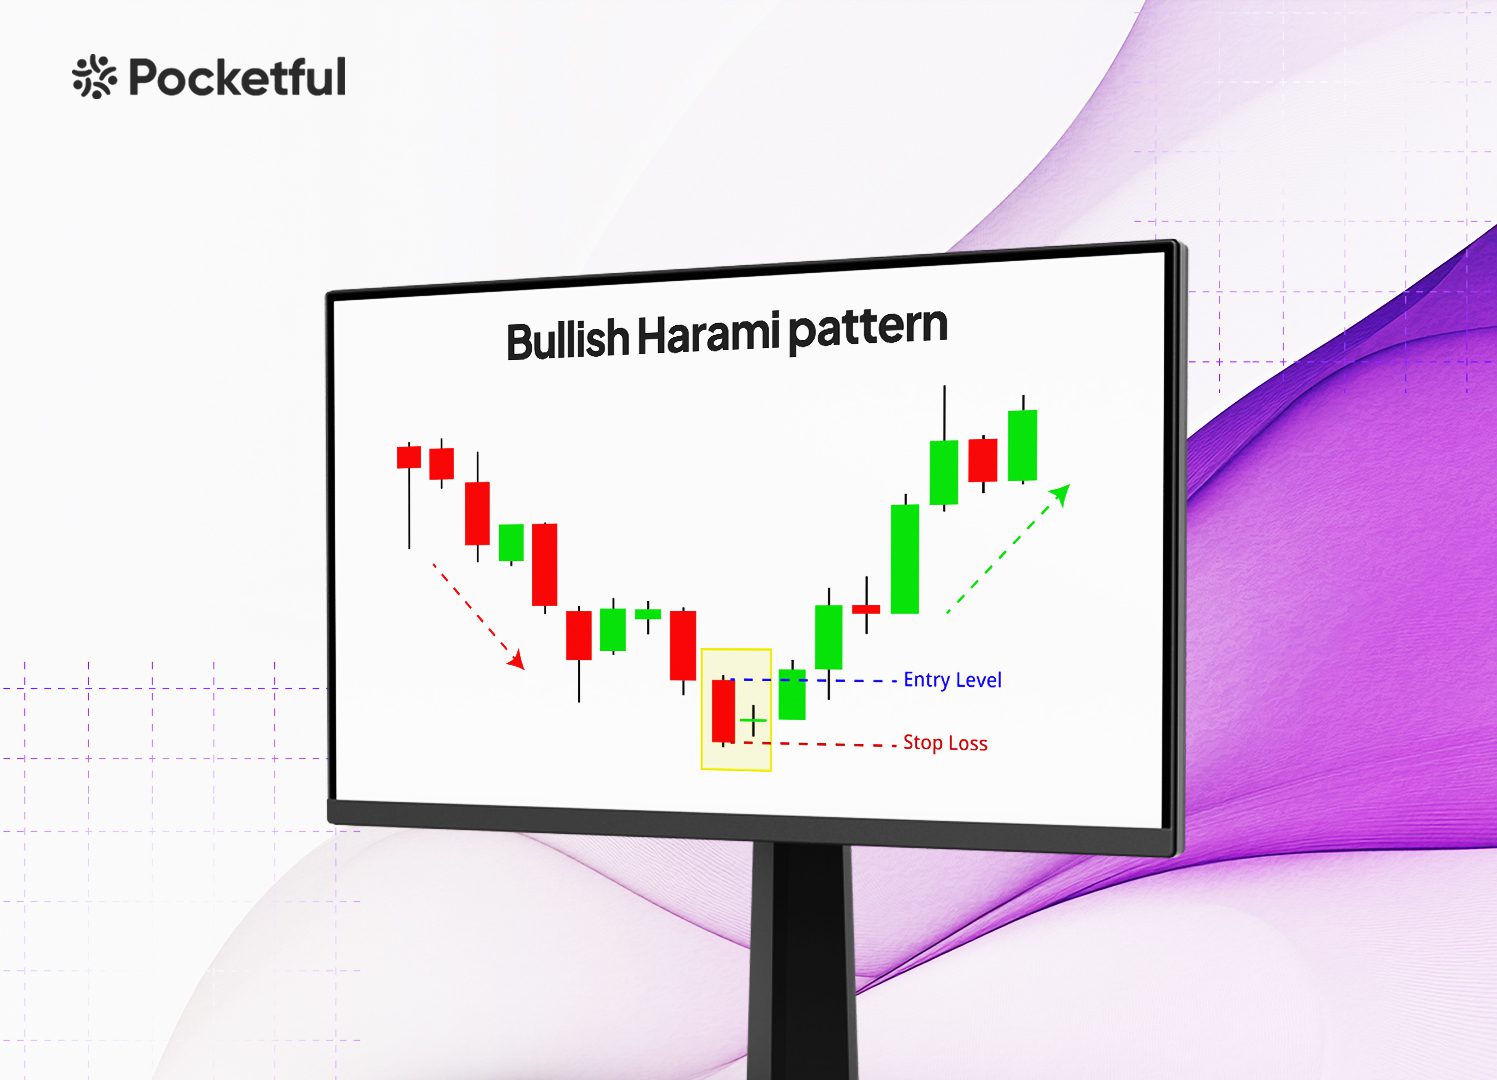
A Bullish Harami pattern is a bullish reversal pattern with two candlesticks, which signifies a change from a downward to an upward trend. The Bullish Harami pattern consists of two candlesticks:
1. First Candle – The first candle is a long bearish candlestick that indicates the continuation of the downturn and constant selling pressure.
2. Second Candle – The second candle is a tiny bullish candle that forms within the first candle’s range and signifies that buyers are taking control of the market and the sellers are losing control.
Read Also: Closing White Marubozu Pattern
Interpretation of Bullish Harami Candlestick Pattern
Traders can interpret the pattern on the following aspects:
1. Sentiment – Determining the momentum of the stock price also heavily depends on the market’s sentiment. A big bearish candle shows that sellers are aggressively pushing the stock price downwards. A smaller bullish candle after the downtrend suggests positive enthusiasm in the market, and the downtrend may be nearing its end.
2. Next Candle – Investors can view this as a buying opportunity if the candle that forms after the Bullish Harami pattern is also bullish and closes higher than the open price of the first candle, indicating that buyers are taking control.
How to Determine Target?
A couple of the techniques used to identify the target in a Bullish Harami pattern are listed below:
1. Resistance Level – A trader can identify the nearest resistance level and use that as a target level.
2. Previous High – The previous highs made by the stock previously can be considered as a target.
How to Determine Stop-loss?
To determine the stop-loss while trading a Bullish Harami pattern, some effective methods are mentioned below-
1. Low of Bullish Candle – Traders can place the stop-loss just below the low of the bullish candle or the second candle of the Bullish Harami pattern.
2. Low of the Bullish Harami Pattern – The stop-loss can also be placed below the low of the first bearish candle of the Bullish Harami pattern.
3. Support Level – The nearest support level can also be considered as a stop-loss before taking any long position.
4. Risk Reward – One can also set a stop-loss based on their risk appetite or as a fixed percentage of their total investment in such stock.
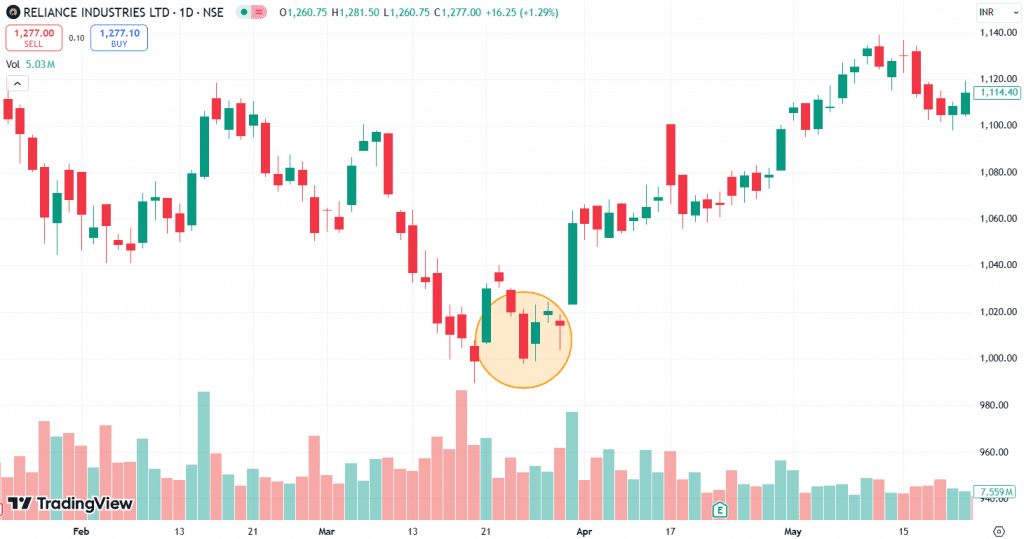
Example of Bullish Harami Candlestick Pattern of Reliance Industries Ltd.

The Reliance Industries daily chart pattern above shows a Bullish Harami Candlestick Pattern. A bearish candle first forms on the chart on 24 March 2023, followed by a bullish candle with open and close prices within the range of the first bearish candle. The appearance of the bullish candle shows the buyers are gaining control. On 28 March 2024, the stock gave a breakout above the high of the first candle and closed at INR 1,020. From the image above, we can see that the stock made a high of INR 1,100 on 17 April 2024.
Advantages of Bullish Harami Candlestick Pattern
The major advantages of the Bullish Harami candlestick pattern are as follows-
1. Early Indication – The Bullish Harami candlestick pattern provides an early indication of a trend reversal as it indicates that the trend is changing from bearish to bullish.
2. Low Risk – This pattern generally forms at the end of a bearish trend or near the lowest point of the downtrend. The downside is limited, which helps traders achieve a good risk-to-reward ratio.
3. Simple – Identification of this pattern is simpler than other technical candlestick patterns.
4. Timeframes – This pattern can be used across various timeframes ranging from hourly to weekly and monthly.
Disadvantage of Bullish Harami Candlestick Pattern
The major disadvantages of the Bullish Harami candlestick pattern are as follows-
- Reliability – During a strong downtrend, this pattern might not be very reliable as market sentiment can overpower the bullish reversal signal.
- False Signal – This candlestick pattern indicates a minor bullish pullback, which can lead to a false breakout above the pattern. Hence, this pattern must be used with other technical tools.
- Additional Confirmation – The Bullish Harami pattern requires additional confirmation from the following candles, which can delay the entry point and cause the traders to miss out on profits.
Read Also: Three Inside Up Pattern
Conclusion
To sum up, traders use the Bullish Harami candlestick pattern as it makes it easy to spot the turning point in a downward trend. A trader should, however, wait for a bullish candle that confirms the Bullish Harami pattern. In order to reduce losses in the event of market volatility, it is advised that traders set a stop-loss below the bottom of the Bullish Harami pattern. Before making any investments, you are advised to speak with your investment advisor.
Frequently Asked Questions (FAQs)
Is Bullish Harami a reliable trading pattern?
A Bullish Harami pattern is considered more reliable when it appears in an established downtrend and is used with other technical patterns.
What will be the target of the Bullish Harami pattern?
The target price of the Bullish Harami pattern can be considered as the nearest resistance level or as per the risk-to-reward ratio.
Is the Bullish Harami a continuation or trend reversal pattern?
The Bullish Harami is a bullish trend reversal pattern, typically appearing during a downtrend and indicating a potential bullish reversal.
Is the Bullish Harami pattern a leading or lagging indicator?
It is considered a leading indicator because the upside movement in the stock price starts after the formation of this pattern.
Can a beginner use the Bullish Harami pattern?
The Bullish Harami pattern is easy to identify and has clear entry, target and stop-loss levels, which makes it easy for beginners to use.
Disclaimer
The securities, funds, and strategies discussed in this blog are provided for informational purposes only. They do not represent endorsements or recommendations. Investors should conduct their own research and seek professional advice before making any investment decisions.