
| Type | Description | Contributor | Date |
|---|---|---|---|
| Post created | Pocketful Team | Oct-11-24 |
Read Next![]()
- MCX Trading: What is it? MCX Meaning, Features & More
- Top 10 Intraday Trading Strategies & Tips for Beginners
- How to Use Pivot Points in Intraday Trading?
- What is Intraday Trading?
- Understanding Intraday Trading Timings
- How to Choose Stocks for Intraday the Right Way?
- Blending Candlestick Patterns: How It Works, Benefits & Drawbacks
- Market Order Vs Limit Order: What’s the Difference?
- Silver Futures Trading – Meaning, Benefits and Risks
- What is Crude Oil Trading and How Does it Work?
- Top Algorithmic Trading Strategies of 2025
- What is Paper Gold? – Meaning, Types, & Benefits
- What is Algo Trading?
- What is Tick Trading? Meaning & How Does it Work?
- Rising Window Candlestick Pattern
- Black Candle Pattern
- Piercing Pattern
- High-Wave Candlestick Chart Pattern
- Closing Black Marubozu Candle
- What is the Best Time Frame for Swing Trading?

- Blog
- trading
- candlestick patterns
- bullish tasuki line pattern
Bullish Tasuki Line Pattern
|
|
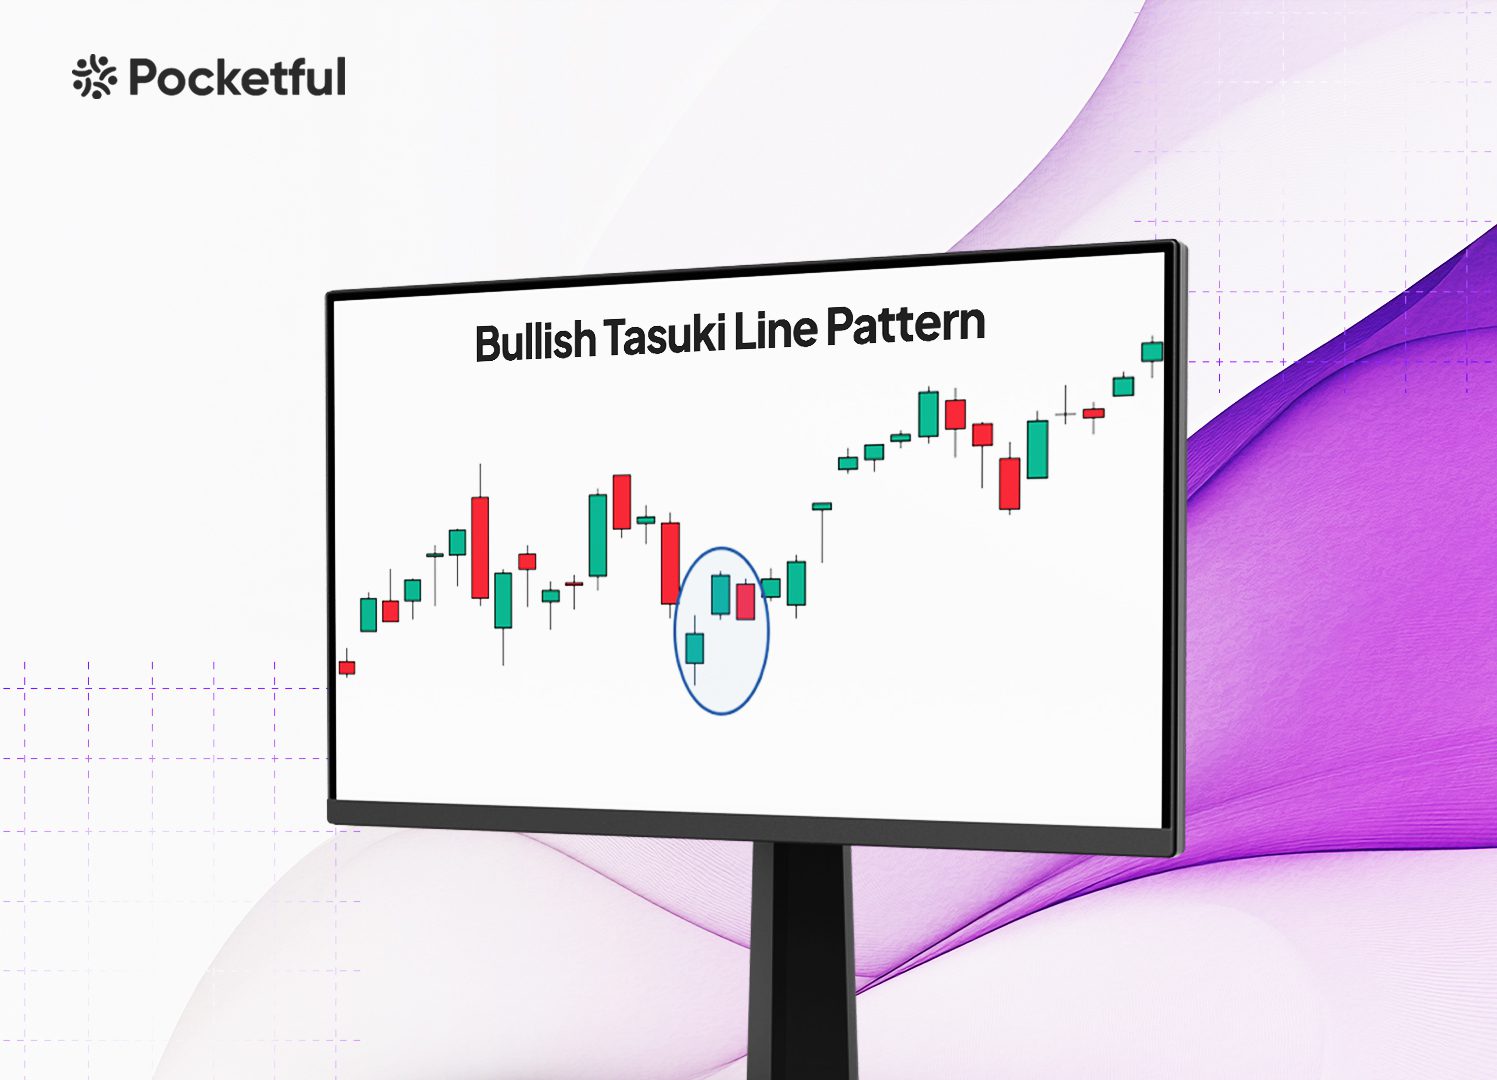
The Bullish Tasuki Line pattern is a bullish reversal pattern that is valuable for traders trying to predict future uptrends. The pattern consists of two candles that indicate the weakening of the downtrend and expected bullish movement. Therefore, it is necessary to know how this particular pattern works so that traders can find just the right entry and exit points for trading.
In this blog, we will explore the Bullish Tasuki Line pattern, its interpretation, advantages, and limitations. Moreover, we will discuss how to trade using this pattern with the help of an example.
What is the Bullish Tasuki Line Pattern?
The Bullish Tasuki line is a bullish reversal pattern that forms when the market momentum changes from a downtrend to an uptrend. It is a two-candle pattern, and it looks as explained below:
- The First Candle: A bearish candle appears in a downtrend. This candle’s high is above the previous candle’s low, and its long body shows great selling pressure.
- The Second Candle: It is a bullish candle that opens above or equal to the previous candle’s closing price and closes above the previous candle’s opening price. The candle has a long body, which shows that bulls are regaining control and driving the price higher.
Bullish Tasuki Line Interpretation
The Bullish Tasuki Line pattern indicates that even though there has been an established downtrend, the bulls are about to gain control of the markets. Even if the first candle is bearish, the second big bullish candle denotes that the selling pressure may be weakening, and the market will most probably move upwards. Some of the main points to be remembered are as follows:
Key Features of the Bullish Tasuki Line
- Reversal Signal: The pattern shows that the markets were in a downtrend, which would reverse shortly, and an uptrend would begin.
- Volume Confirmation: A high trading volume accompanying the bullish candle usually validates the strength of the trend and confirms the reliability of the pattern.
Read Also: Downside Tasuki Gap Candlestick Pattern
How to Determine Target and Stop-Loss?
For traders utilizing the Bullish Tasuki Line candlestick pattern, setting appropriate targets and stop-loss levels is important. Below is a guide on how to determine these key factors:
- Entry Point: After the second candle closes above the high of the previous bearish candle, one usually places a buy order, anticipating the price will continue moving upwards.
- Target Price: The target price can be determined using the nearest major resistance levels, Fibonacci levels, or as per risk-reward ratio.
- Stop-Loss (SL): A stop-loss is usually placed below the low of the bullish candle to reduce losses in case the pattern gives a false breakout.
Example of Bullish Tasuki Line Pattern for Reliance Industries
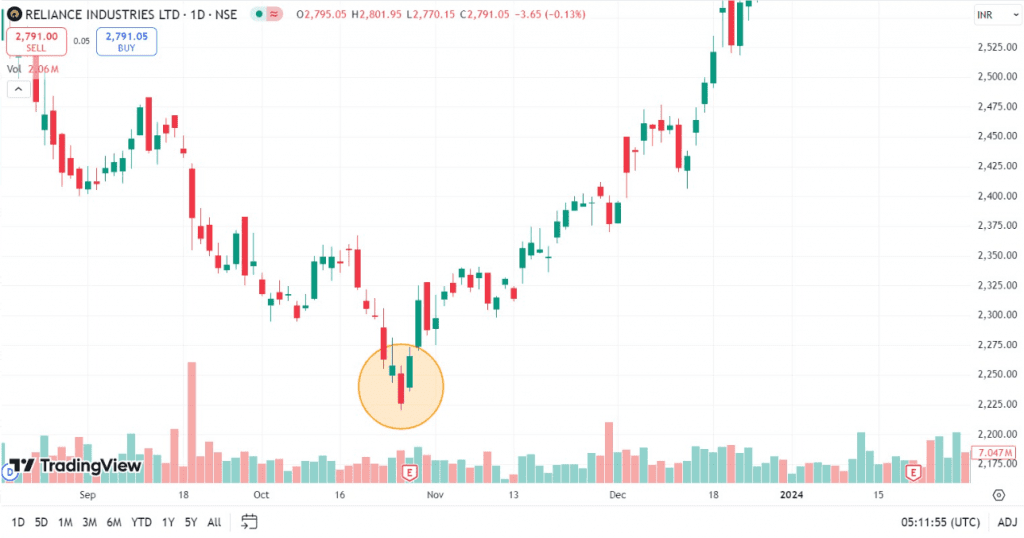
The above image shows the daily chart of Reliance Industries Ltd.,
- First Candle: A bearish candle in a downtrend closing at ₹2,226. The high of this candle is above the previous low price, which indicates the weakening of the selling pressure.
- Second candle: A bullish candle opening at INR 2,240, which is slightly above the previous candle’s closing price of INR 2,226. This bullish candle closes at INR 2,265, i.e., higher than the high of the previous candle of INR 2,258.
In this scenario, the closing price of the second candle above the high price of the first candle signals a bullish reversal.
Trading Strategy Using This Pattern:
- Entry: An individual can create a long position at INR 2,312 after the formation of another bullish candle after the pattern.
- Stop Loss: A stop-loss can be set just below the low of the second bullish candle, that is, around ₹2,235, to manage the risk.
- Target Price: A target price can be set at the nearest major resistance level, i.e. INR 2,485, which was achieved.
The Bullish Tasuki Line signals the end of the bearish momentum and the beginning of a bullish reversal. A trader can look for additional confirmation from volume data and additional indicators before creating a long position.
Bullish Tasuki Line Advantages
The Bullish Tasuki Line candlestick pattern is advantageous to traders in the following aspects:
- Clear entry and exit points: You know exactly when to enter into the trade and at what point to exit the trade.
- Reliable Signal: It is a reliable bullish reversal signal and can be used to predict an uptrend.
- Risk Management: The Bullish Tasuki Line pattern provides stop-loss levels to protect against a possible bearish movement.
- Simplicity: This pattern is easy to recognize and can be used by novice traders.
Limitations of Bullish Tasuki Line
Though the Bullish Tasuki Line is a very important technical indicator, it has some limitations listed below:
- False Signals: Like other technical indicators, it may provide false signals at times, particularly in highly volatile markets.
- Needs Confirmation: Very often, the pattern needs to be confirmed with other technical indicators to avoid entering into a wrong trade.
- Infrequent Occurrence: This pattern doesn’t occur frequently.
- Non-reliable in Sideways Markets: It is reliable in trending markets and will probably not work well in sideways or choppy markets.
Read Also: Upside Tasuki Gap Pattern
Conclusion
An extremely useful pattern at the end of a downtrend, the Bullish Tasuki Line candlestick pattern can give clear entry points and risk management strategies. Although it gives a very strong bullish signal, the trader needs to combine this with other technical tools to avoid false signals and to enhance trading decisions in various market conditions. It is advised to consult a financial advisor before trading.
FAQs(Frequently Asked Questions)
Is the Bullish Tasuki Line candlestick pattern reliable?
Yes, it is reliable, especially when it forms after a downtrend. However, confirmation from other indicators can increase the reliability of the pattern.
Can a Bullish Tasuki Line be applied to all time frames?
It can be applied to any time frame but works best for higher time frames like daily charts.
What’s a good additional indicator to use with the Bullish Tasuki Line?
Most traders rely on moving averages or volume data to confirm the pattern’s validity.
What should be the stop-loss for a Bullish Tasuki Line pattern?
A stop-loss can be placed just below the low of the bullish candle to protect against false signals.
How frequently does the Bullish Tasuki Line candlestick pattern appear?
The pattern is rather rare because the conditions wherein it forms are somehow scarce.
Disclaimer
The securities, funds, and strategies discussed in this blog are provided for informational purposes only. They do not represent endorsements or recommendations. Investors should conduct their own research and seek professional advice before making any investment decisions.