
| Type | Description | Contributor | Date |
|---|---|---|---|
| Post created | Pocketful Team | Sep-21-24 |
Read Next![]()
- MCX Trading: What is it? MCX Meaning, Features & More
- Top 10 Intraday Trading Strategies & Tips for Beginners
- How to Use Pivot Points in Intraday Trading?
- What is Intraday Trading?
- Understanding Intraday Trading Timings
- How to Choose Stocks for Intraday the Right Way?
- Blending Candlestick Patterns: How It Works, Benefits & Drawbacks
- Market Order Vs Limit Order: What’s the Difference?
- Silver Futures Trading – Meaning, Benefits and Risks
- What is Crude Oil Trading and How Does it Work?
- Top Algorithmic Trading Strategies of 2025
- What is Paper Gold? – Meaning, Types, & Benefits
- What is Algo Trading?
- What is Tick Trading? Meaning & How Does it Work?
- Rising Window Candlestick Pattern
- Black Candle Pattern
- Piercing Pattern
- High-Wave Candlestick Chart Pattern
- Closing Black Marubozu Candle
- What is the Best Time Frame for Swing Trading?

- Blog
- trading
- candlestick patterns
- bullish three line strike pattern
Bullish Three-Line Strike Pattern
|
|
A Bullish Three-Line Strike pattern is one of those patterns that rarely occurs and gives a bold signal of trend reversal in the face of strong bullish momentum. However, a group of technical analysts disagree and consider it a continuation pattern. Let’s look at the Bullish Three-Line Strike pattern in detail and find out whether it is a reversal or a continuation pattern with the help of examples. Moreover, we will discuss the advantages and limitations of the pattern.
What is a Bullish Three-Line Strike Pattern?
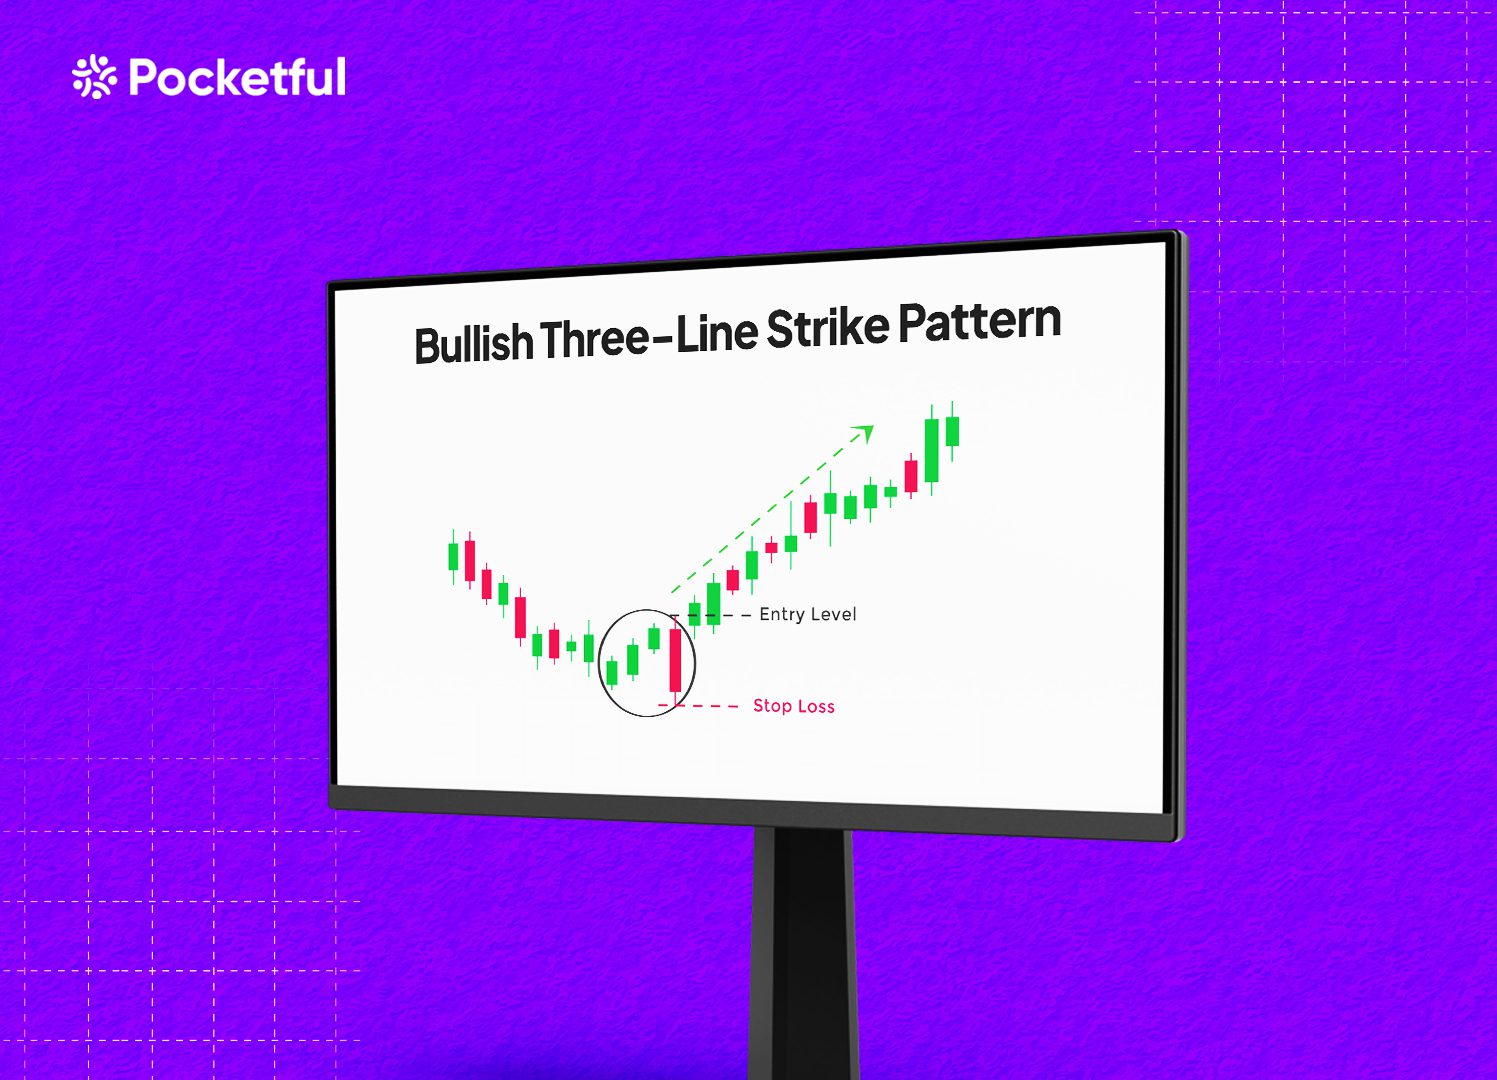
The Bullish Three-Line Strike candlestick pattern consists of four candlesticks. The first three candles are bullish, followed by one large bearish candle that engulfs the previous three candles. This pattern signals a reversal from the current bullish trend after the fourth big bearish candle engulfs the three bullish candles.

The Bullish Three-Line Strike candlestick pattern consists of three consecutive bullish candles, each with higher highs, followed by a big bearish candle. Some analysts described it as a bullish continuation pattern, but Bulkowski disagreed and said trend reversal happens when a big red candle engulfs the previous three candles. The bullish candle signals a bullish reversal when the price closes below the low of the first bullish candlestick.
As per Bulkowski, the Bullish Three-Line Strike candlestick pattern signals a bearish reversal 65% of the time instead of the bullish continuation pattern, which generally candlestick theory suggests.
Pattern Interpretation
The Bullish Three-Line Strike candlestick pattern can be easily understood through the following key points:
- Formation: The pattern consists of three bullish candles, and the fourth candle appears as a strong bearish candle that engulfs all three bullish candles.
- Price Action: The fourth bearish engulfing candle suggests the sellers are in control and a strong shift in market sentiments from bullish to bearish.
- Market Sentiments: It often occurs near the end of a prolonged bullish trend as the market struggles to find direction.
- Volume: Volume can also be erratic during the formation of the pattern, but during the breakdown, look for an increase in volume for a strong confirmation.
- Breakout: The pattern can give a breakout in either direction. However, it generally generates a reversal signal when the price moves below the low of the three-candle formation.
- Risk Management: Proper stop-loss placement and risk management strategies are crucial while using any pattern.
Trading Setup
The Bullish Three-Line Strike candlestick pattern can be effectively used by following the below trading setup:
- Entry Point: Since it is a reversal pattern, wait for a breakdown below the low of the previous three bullish candles. Further confirmation from an increase in volume is important to avoid false breakdowns.
- Stop-Loss: A stop-loss can be placed above the low of the first bullish candlestick to manage risk if the pattern gives a false breakout.
- Target: Take profit at the nearest significant support level or as per your risk-to-reward ratio.
Read Also: Three-Line Patterns
Advantages of Bullish Three-Line Strike Pattern
The advantages of the Bullish Three-Line Strike pattern are:
- It works in any market, such as equity, currency, or commodity market.
- It works more efficiently in a shorter time frame.
- It is a reversal signal indicator.
- The candlestick pattern is easy to identify.
- This pattern has the potential to generate big moves.
- The pattern works well with other indicators.
- This pattern gives a complete setup for stop-loss and target.
- This pattern gives quite accurate results in trending markets with strong volumes.
Limitations of Bullish Three-Line Strike Pattern
The limitations of the Bullish Three-Line Strike pattern are:
- The pattern could give false signals, which can result in losses in choppy and sideways markets.
- The Bullish Three-Line Strike candlestick pattern occurs rarely.
- The pattern is of limited use in markets with low volumes.
- Confirmation from other indicators may be required to accurately predict reversal.
- The candlestick pattern can generate false signals.
- This pattern could be affected by various market factors like volatility, news, policy change, political instability, or other factors.
Example 1: Bullish Three-Line Strike Pattern for Tata Motors
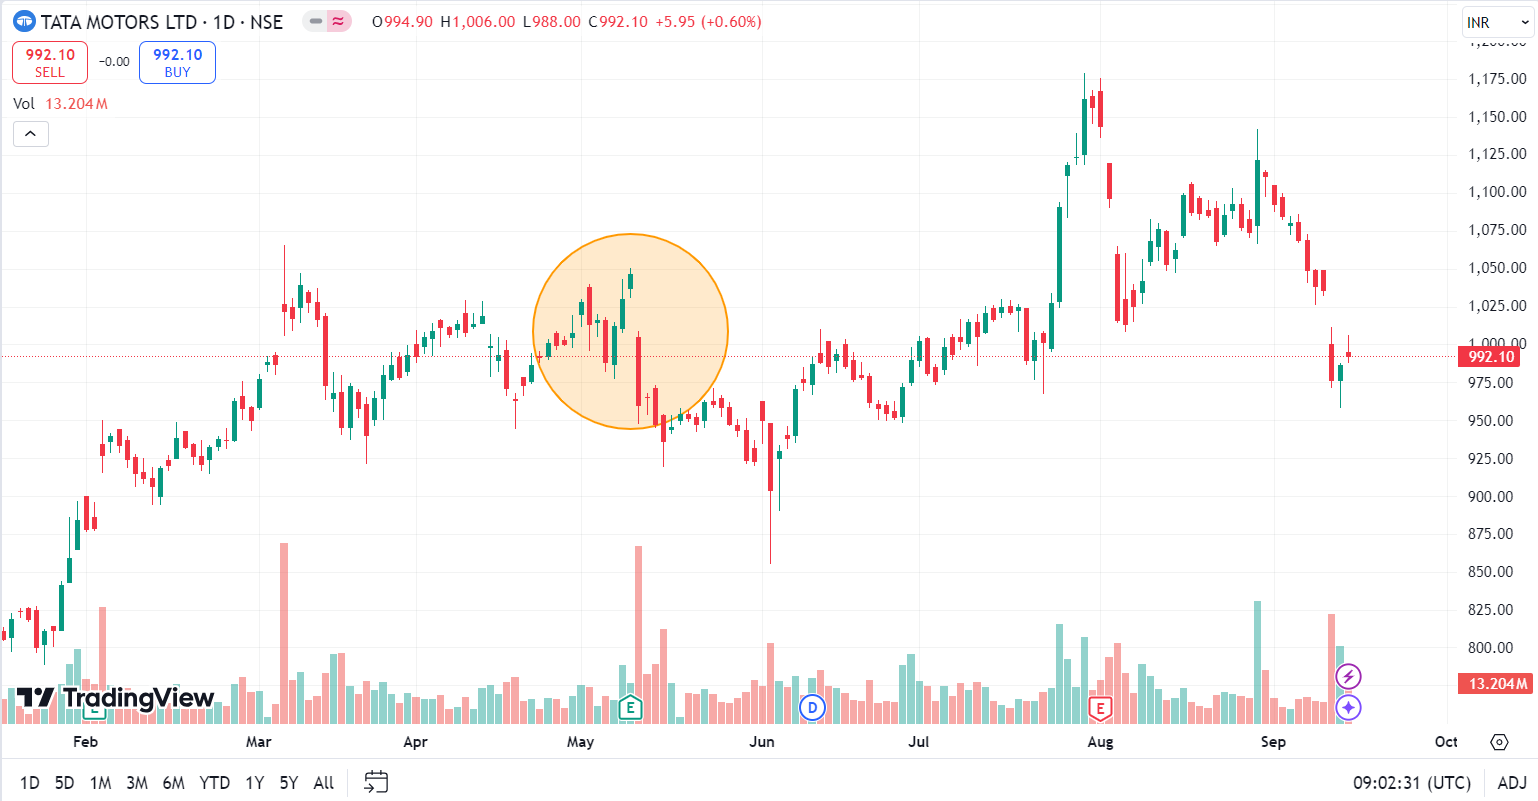
The above image shows the price of Tata Motors stock on a daily time frame. The stock made a Bullish Three-Line Strike pattern from 8 May 2024 to 13 May 2024. In the initial bullish move, the stock moved from INR 986 to INR 1,046, and on 13 May 2024, a big bearish candle closed at INR 959, i.e., below the low point of the first bullish candlestick. The bearish engulfing candlestick gave a breakdown with huge volumes and confirmed the bearish reversal. From the chart above, we can see that the stock made lower lows in the following days.
Read Also: Bearish Three-Line Strike Pattern
Conclusion
The Bullish Three-Line Strike candlestick pattern is a powerful pattern that usually generates a reversal signal in a bullish trend. It consists of three consecutive bullish candles followed by a large bearish candle that engulfs the previous three candles, signaling a shift in market sentiment from bullish to bearish. While it provides a strong indication of a potential reversal, it is important to confirm the signal with other technical indicators or studies and use appropriate strategies for risk management, such as stop-losses and target levels, before entering a trade. The pattern occurs rarely but has the potential to generate huge gains. Hence, it is very important to understand the pattern’s characteristics, trade setup, and risk management before using this pattern. It is advised to consult a financial advisor before investing.
Frequently Asked Questions (FAQs)
What does the Bullish Three-Line Strike pattern indicate?
It suggests a potential reversal of the prevailing bullish trend.
What is the success rate of the Bullish Three-Line Strike pattern?
The Bullish Three-Line Strike pattern’s accuracy depends upon the market conditions, liquidity of the asset, and time frames. It is more effective in a shorter time frame and trending markets.
Can the Bullish Three-Line Strike pattern fail?
Like any other chart pattern, this pattern also gives false breakouts, particularly if a breakout occurs with low volumes or market conditions and news is against the pattern.
How reliable is the Bullish Three-Line Strike Pattern?
It can be a strong signal for trend reversal, but its reliability increases when confirmed by other technical indicators or studies like RSI, Moving averages, and support and resistance levels.
What is the basic structure of the Bullish Three-Line Strike pattern?
A Bullish Three-Line Strike pattern is formed when three bullish candles make consecutive highs, followed by a big bearish candle that covers all the previous three candles.
Disclaimer
The securities, funds, and strategies discussed in this blog are provided for informational purposes only. They do not represent endorsements or recommendations. Investors should conduct their own research and seek professional advice before making any investment decisions.