
| Type | Description | Contributor | Date |
|---|---|---|---|
| Post created | Pocketful Team | Sep-24-24 |
Read Next![]()
- MCX Trading: What is it? MCX Meaning, Features & More
- Top 10 Intraday Trading Strategies & Tips for Beginners
- How to Use Pivot Points in Intraday Trading?
- What is Intraday Trading?
- Understanding Intraday Trading Timings
- How to Choose Stocks for Intraday the Right Way?
- Blending Candlestick Patterns: How It Works, Benefits & Drawbacks
- Market Order Vs Limit Order: What’s the Difference?
- Silver Futures Trading – Meaning, Benefits and Risks
- What is Crude Oil Trading and How Does it Work?
- Top Algorithmic Trading Strategies of 2025
- What is Paper Gold? – Meaning, Types, & Benefits
- What is Algo Trading?
- What is Tick Trading? Meaning & How Does it Work?
- Rising Window Candlestick Pattern
- Black Candle Pattern
- Piercing Pattern
- High-Wave Candlestick Chart Pattern
- Closing Black Marubozu Candle
- What is the Best Time Frame for Swing Trading?

- Blog
- trading
- candlestick patterns
- dark cloud cover
Dark Cloud Cover Candlestick Pattern
|
|
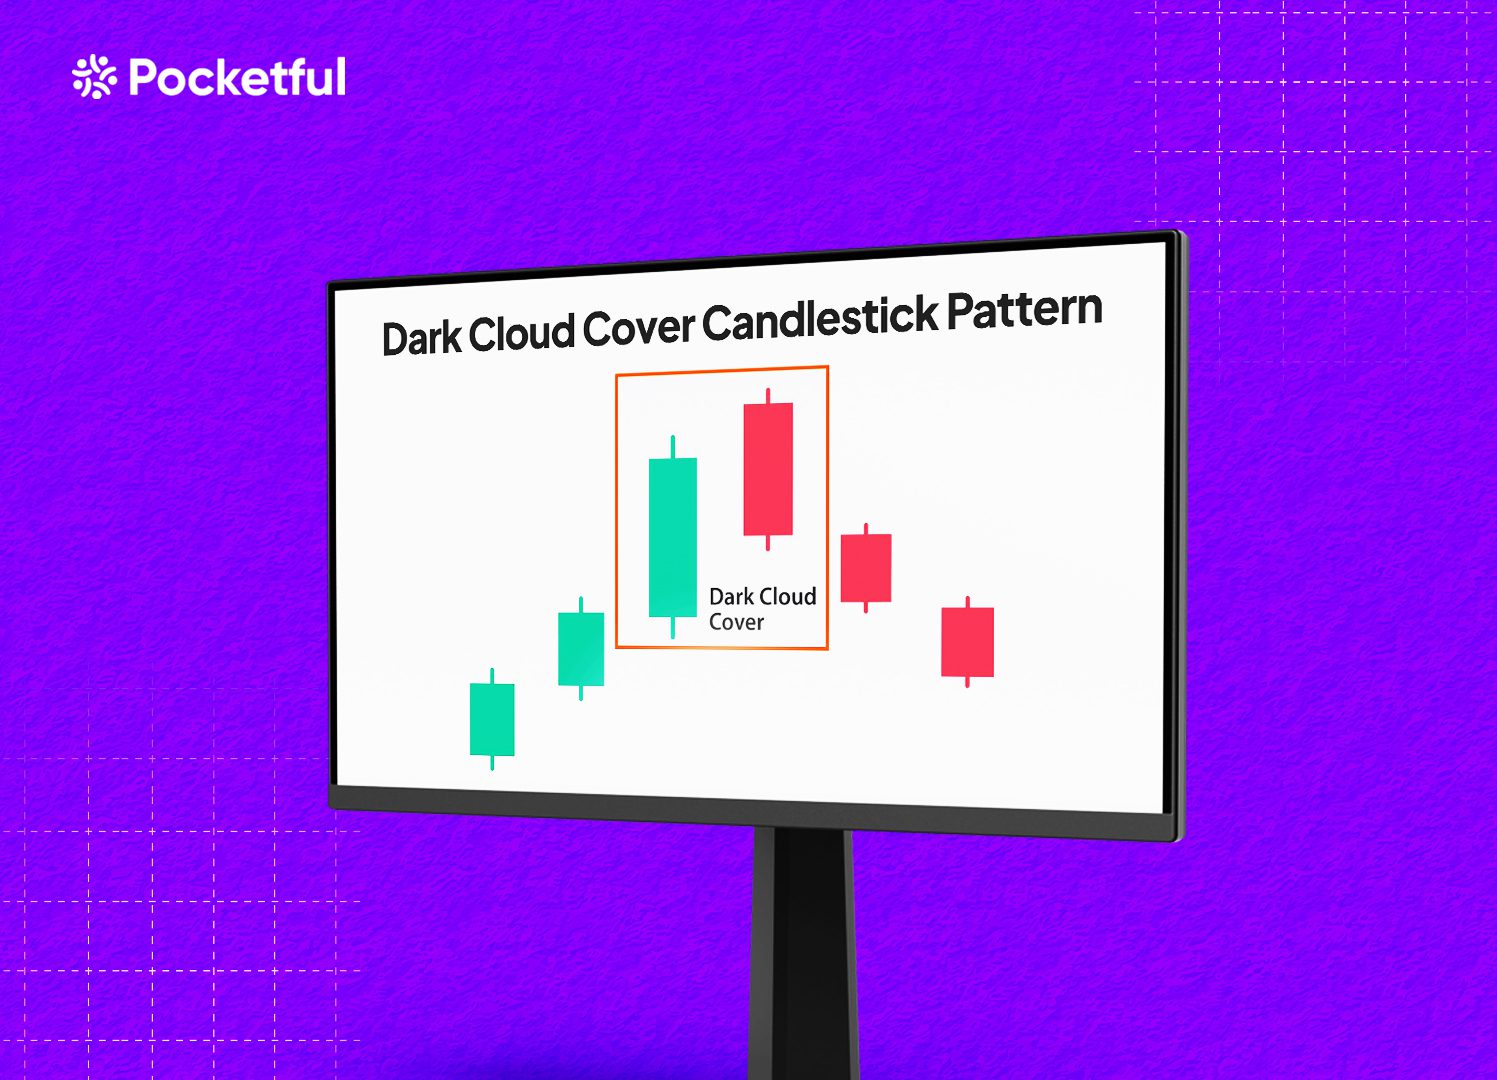
Are you eager to enhance your technical analysis skills in anticipating a bearish reversal? This candlestick pattern can assist you in recognising possible trend reversals. This blog will examine the Dark Cloud Cover pattern, its components, trading implications, advantages, and limitations, along with a real-world example. Understanding this pattern can help seasoned traders and beginners identify bearish reversals in the financial markets.
What is a Dark Cloud Cover Candlestick Pattern?
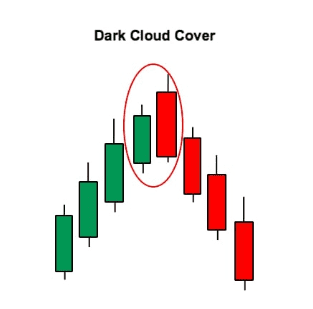
The Dark Cloud Cover candlestick pattern signifies a bearish reversal, suggesting a possible shift from an uptrend to a downtrend. The pattern consists of two candlesticks mentioned below:
- Bullish Candle: A strong bullish candle that opens and closes well above the previous day’s closing price.
- Bearish Candle: A bearish candle emerges when it opens above the previous day’s high and closes beneath the midpoint of the preceding bullish candle.
Although the pattern indicates a possible reversal, a trader can create a short position when a bearish candle closes beneath the midpoint of a preceding bullish candle. Conservative traders may prefer to seek additional confirmation before making any trading decisions.
Interpretation of Dark Cloud Cover Pattern
In an uptrend, a large green candle is followed by a red candle that opens higher but closes lower than the midpoint of the preceding bullish candle, marking a possible shift from buying strength to selling pressure. This could suggest that the market is struggling to move upwards, and a downtrend might start.
Key indicators of a possible reversal are a gap-up and a bearish candle opening above the high of a bullish candle, indicating an unexpected spike in selling pressure. The candle closing beneath the midpoint of a bullish candle indicates a change in momentum.
How to determine Target and Stop-Loss?
Traders strive for a risk-reward ratio of at least 1:2, indicating that the profit should be at least double the amount they risk. Support levels can also act as targets after the formation of the Dark Cloud Cover.
In the case of stop-loss, a common method is to set the stop-loss above the high of the bullish candle in the Dark Cloud Cover pattern. Additionally, the decision regarding the stop-loss depends on your risk tolerance. Risk-averse traders prefer a tighter stop-loss, while aggressive traders may choose a wider stop-loss.
Read Also: Black Candle Pattern
Example of Dark Cloud Cover Pattern
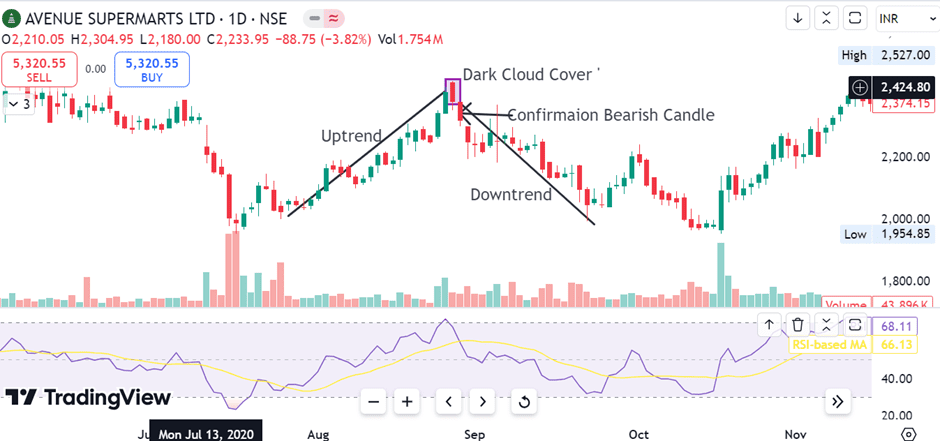
The image above shows the ‘Dark Cloud Cover’ candlestick pattern on the daily timeframe of DMart (Avenue Supermarts Limited). A clear Dark Cloud Cover pattern can be seen when a bearish candle is formed after a bullish candle. The bearish candlestick closed below the midpoint of the previous bullish candlestick, and the asset price declined afterward, signifying a downtrend.
Advantages of Dark Cloud Cover Pattern
The advantages of Dark Cloud Cover are:
- Early Warning Signal – It helps traders detect possible trend reversals, enabling them to adjust their positions before a major price drop.
- Reliability – Research shows that the dark cloud cover pattern is a reliable candlestick pattern for predicting bearish trend reversals, particularly when it is supported by additional technical indicators such as RSI, MACD, etc.
- Improves Risk Management – Traders can enhance their risk management strategies by recognising a bearish reversal early. This helps them exit long positions before the market price declines.
- Applicable across Markets – This pattern is effective across multiple markets, such as stocks, forex, and commodities.
Limitations of Dark Cloud Cover Pattern
The limitations of Dark Cloud Cover are:
- Need Confirmation – Confirmation is essential as the pattern does not guarantee a reversal. It is important to seek further confirmation, such as the emergence of a third bearish candle or signals from additional technical indicators.
- Subjective Interpretation – Assessing whether the second candle closes beneath the midpoint of the first candle can be a matter of personal interpretation. Minor variations in how traders determine the midpoint can result in contrasting views on the validity of the pattern.
- Timeframe Sensitivity – The efficacy of the pattern can change depending on the time frame selected. It tends to be more reliable on longer timeframes, such as daily and weekly charts, while it offers less reliability on shorter time frames, like hourly and minute charts.
- False Signals – Despite being a powerful indicator, it can occasionally generate misleading signals, especially in volatile or sideways markets.
Read Also: Introduction to Bearish Candlesticks Patterns: Implications and Price Movement Prediction
Conclusion
To sum up, the Dark Cloud Cover candlestick pattern is an essential tool for traders aiming to spot bearish reversals. Its easy-to-understand structure provides an early alert for possible changes in market sentiment, making it invaluable for risk management and short-term trading tactics. However, the need for validation, vulnerability to misleading signals in volatile markets, and other factors show that it should not be trusted independently and must be combined with other indicators. It is advised to consult a financial advisor before trading.
Frequently Asked Questions (FAQs)
When should traders use the Dark Cloud Cover pattern?
Dark Cloud Cover pattern must be used in combination with other technical tools during an uptrend, where a reversal is more likely.
Does volume play a role when trading using the Dark Cloud Cover pattern?
A higher trading volume during the second bearish candle increases the possibility of a downtrend, showing strong selling pressure.
What is the difference between a Dark Cloud Cover and a Bearish Engulfing candlestick pattern?
In the Bearish Engulfing candlestick pattern, the second candle completely engulfs the first, while in Dark Cloud Cover, the second candle closes below the midpoint but does not engulf the preceding bullish candle.
Should I rely solely on the Dark Cloud Cover pattern for trading decisions?
No, it is best to use the Dark Cloud Cover pattern in combination with other technical tools and analysis of broader market conditions.
What does the gap up in the Dark Cloud Cover pattern denote?
The gap up in the Dark Cloud Cover candlestick pattern signifies a sudden surge in the buying pressure, which quickly reverses and the asset price declines.
Disclaimer
The securities, funds, and strategies discussed in this blog are provided for informational purposes only. They do not represent endorsements or recommendations. Investors should conduct their own research and seek professional advice before making any investment decisions.