| Type | Description | Contributor | Date |
|---|---|---|---|
| Post created | Pocketful Team | Nov-22-24 |

- Blog
- trading
- candlestick patterns
- downside tasuki gap
Downside Tasuki Gap Candlestick Pattern

Have you ever seen a scenario in which the asset price is consistently declining and suddenly starts consolidating before moving further down? The scenario described can be seen on the chart in the form of a Downside Tasuki Gap pattern. Traders constantly search for such opportunities to make huge profits.
In this blog, we will discuss the Downside Tasuki Gap pattern and its interpretation. Moreover, we will understand the trade setup with the help of a real-world example.
What is the Downside Tasuki Gap pattern?
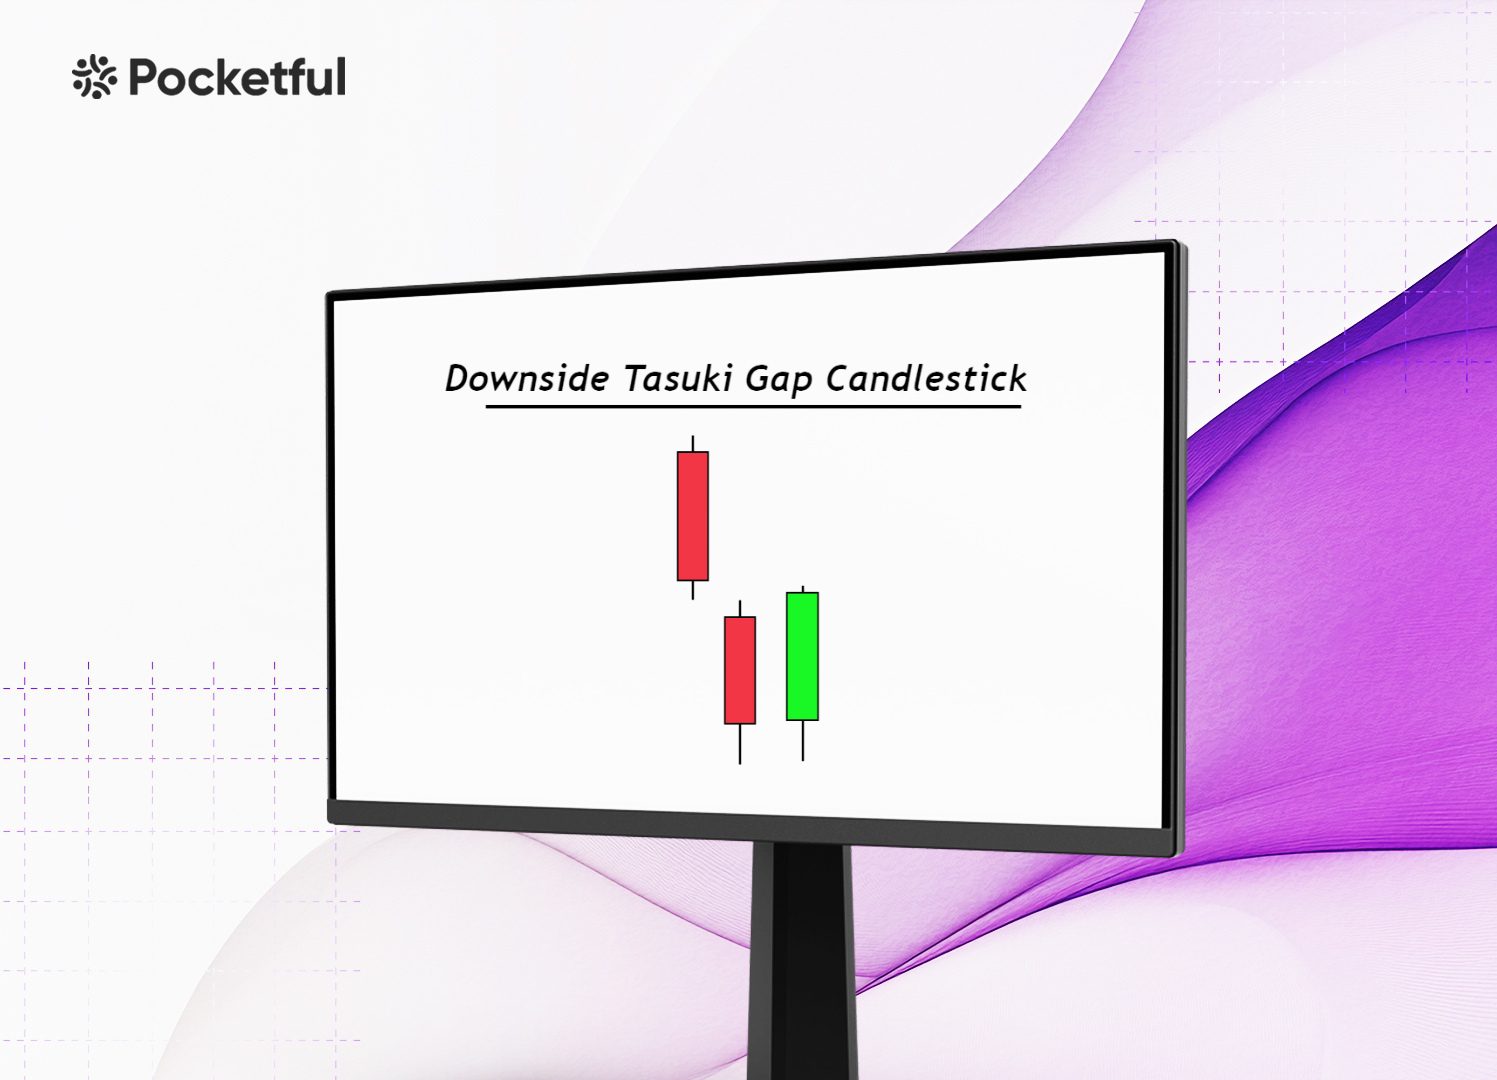
The Downside Tasuki Gap is a bearish continuation pattern seen in candlestick charts, indicating the potential ongoing downward momentum in stock or asset is expected to continue. This pattern appears during a downtrend and is made up of three distinct candles.
- First Candle: The first candle is bearish, which signifies selling pressure.
- Second Candle: The second candle opens with a gap down, continuing with the negative sentiment, and closes considerably below the close of the first candle.
- Third Candle: The third candle is bullish, opens within the previous candle’s body and attempts to fill the gap created between the second candle and the first candle. However, it fails to fill the gap.
Interpretation
The Downside Tasuki Gap pattern is interpreted as a strong bearish signal, suggesting that selling pressure is dominant and a downtrend is likely to persist. When this pattern forms, it indicates that the sellers are pushing the prices lower, with buyers unable to regain control even as they attempt to fill the gap with the third bullish candle. The inability of the third candle to close above the gap signals a bearish sentiment and a lack of buying momentum. Traders view this as a confirmation of the downtrend, often using it to enter or add to short positions in anticipation of further declines. In essence, the pattern reflects sustained bearish sentiment, reinforcing the notion that the downward momentum is still intact.
Read Also: Bullish Tasuki Line Pattern
How to Determine Target and Stop-Loss?
Setting the Target and Stop-loss (SL) levels while trading using the Downside Tasuki Gap pattern requires careful technical analysis to manage risk and maximize the potential gains. Here’s a guide to determining each:
Target Price
- Gap Size Measurement: Measure the distance between the close оf the first bearish candle and the open of the second bearish candle. This gap size provides an initial estimate of the likely downward move after the formation of the pattern. Project the gap below the close of the third candle to get a target price.
- Support Levels: Identify nearby support zones based on historical price movements. Set the target price just above these support levels as the prices often pause or reverse near established support.
- Fibonacci extensions: Technical traders often use Fibonacci extensions to set more precise targets.
Stop Loss (SL)
- Above the gap: Set the stop-loss just above the gap between the first and second candles. If the price closes above the gap, it indicates the bearish signal is weakening, making the stop-loss necessary to limit losses.
- Key Resistance Levels: Individuals can place a stop-loss just above the nearest resistance level, as a breakout above resistance could indicate trend reversal.
- Risk-to-Reward Ratio: Ensure the target and SL offer a favorable risk-to-reward ratio, typically 1:2 or 1:3, to optimize potential profits while controlling the losses.
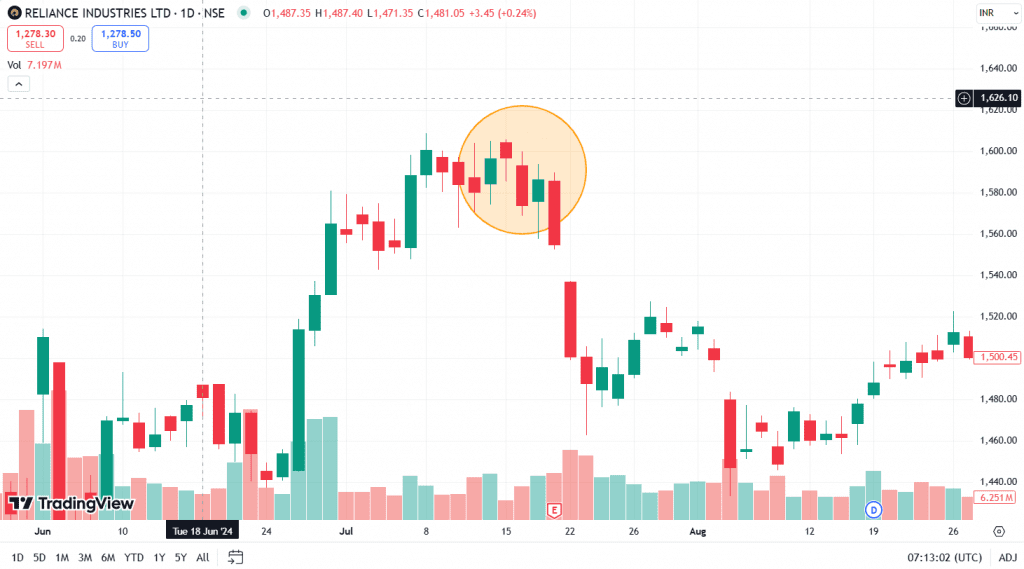
Example of Downside Tasuki Gap of Reliance Industries Ltd.

The above image displays the chart of Reliance Industries (RIL) stock on a daily timeframe. The stock made a high of INR 1,608 on 8 July 2024 and then declined to a low of INR 1,563 on 10 July 2024, indicating a resistance zone near the INR 1,600 level. The stock again tried to give a breakout above the resistance on 15 July 2024 but failed to do so and made a Downside Tasuki Gap pattern on 18 July 2024. The stock fell from 1,586 to INR 1,500 within the next two days.
Advantages of Downside Tasuki Gap Pattern
The advantages of using a Downside Tasuki Gap pattern are:
- Clear Bearish Signal: The pattern strongly indicates a continuation of the downtrend, making it valuable for traders looking to capitalize on bearish market movements.
- Clear entry and exit points: The Downside Tasuki Gap provides the specific points for setting the entry, target and stop-loss (SL) levels, helping individuals in strategic trade planning and effective risk management.
- High Reliability in Downtrends: The Downside Tasuki Gap pattern is more reliable in established downtrends, reflecting sustained selling pressure.
- Versatile Across Markets: The pattern works across various financial instruments, including stocks, forex and commodities, allowing the traders to apply it in different markets.
- Easy Identification: Consisting of only three candles, the Downside Tasuki Gap is easy to identify, making it accessible for traders of all experience levels to spot bearish continuations.
Limitations of Downside Tasuki Gap Pattern
The limitations of using a Downside Tasuki Gap pattern are:
- Limited Accuracy in Isolation: The pattern may not reliably indicate a downtrend if used alone. It works best when combined with other technical indicators to confirm the bearish signal.
- Risk of False Signals: In choppy or sideways markets, the Downside Tasuki Gap can produce false breakouts, which can result in losses.
- Not Ideal for All Market Conditions: This pattern performs best in clear downtrends and may not work well in low volatility or consolidation markets.
- Short-Term Reversal Risk: If the gap fills or if buying pressure emerges, the trend may reverse, which can potentially result in unexpected losses.
Read Also: Upside Tasuki Gap Pattern
Conclusion
The Downside Tasuki Gap pattern can be a valuable tool for traders to identify bearish continuation signals in a downtrend. It offers clear entry and exit points, is easy to recognize and is most effective when used in combination with other technical indicators to confirm trends. Its reliability decreases in choppy or consolidation markets as it can generate false signals, which can lead to a bullish reversal. Understanding how to set accurate stop-loss and target is essential. Overall, the Downside Tasuki Gap is a useful chart pattern for experienced traders when applied strategically in suitable market conditions.
Frequently Asked Questions (FAQs)
What is the Downside Tasuki Gap pattern?
The Downside Tasuki Gap is a bearish continuation candlestick pattern that occurs in a downtrend. It features two bearish candles with a gap between them and is followed by a bullish candle that doesn’t fully close the gap, signaling the potential continuation of the downward trend.
How to identify the Downside Tasuki Gap pattern?
The pattern consists of three candles: a bearish candle, a second bearish candle and a bullish candle with a gap between the first two candles. The third bullish candle partially fills the gap and doesn’t close above it. This confirms that bearish sentiment remains strong.
What does the Downside Tasuki Gap indicate to traders?
The Downside Tasuki Gap pattern indicates that sellers are in control, and the downtrend is likely to continue. Traders often interpret it as a bearish signal to enter or add to short positions.
What are the limitations of using the Downside Tasuki Gap pattern?
It can produce false signals in sideways or consolidation markets. Additionally, setting the accurate stop-loss (SL) and target can be challenging without combining it with other indicators.
Can the Downside Tasuki Gap be used in any market?
The Downside Tasuki Gap pattern can be applied in various financial markets, including stocks, forex and commodities, but it is the most effective in a strong downtrend.
Disclaimer
The securities, funds, and strategies discussed in this blog are provided for informational purposes only. They do not represent endorsements or recommendations. Investors should conduct their own research and seek professional advice before making any investment decisions.