| Type | Description | Contributor | Date |
|---|---|---|---|
| Post created | Pocketful Team | Jul-02-24 |
Read Next![]()
- What Is Leverage in the Stock Market?
- Common Trading Mistakes Beginners Make (And How to Avoid Them)
- How to Pledge ETFs for Margin in India
- What Is Expiry Day Trading?
- Best ETF Platforms for Trading and Investment in India 2026
- What Is Strike Price in Options Trading?
- What is Speculative Trading?
- What is Revenge Trading?
- What Is Time Decay in Options?
- What are Candlestick Patterns? 38 Candlestick Patterns Every Trader Must Know
- How to Read Stock Charts: A Beginner’s Guide to Chart Analysis
- What is Gold Trading?
- Top Algo Trading Programming Languages in 2026
- What is Short-Term Trading Vs Long-Term Trading Strategies?
- NSE Algo Trading Rules for Retail Traders in India
- What is a Harami Candlestick Pattern?
- What is Average Traded Price in Stock Market
- What is MIS in Share Market?
- 7 Common Mistakes in Commodity Trading New Traders Must Avoid
- Brokerage Charges in India: Explained
What is Hammer Candlestick Pattern?
Written by : Pocketful Team
|Updated by : Pocketful Team
Published on : 2nd July 2024
|Updated on : 24th January 2025
Several chart patterns available to traders can be used to determine a stock’s trend. Let’s take an example where you are searching for a trading opportunity, and you come across a stock that is consistently declining. You then notice a pattern that suggests the stock’s price may be about to reverse. One such pattern is the Hammer Candlestick pattern.
In today’s blog post, we’ll explore more about the Hammer Candlestick pattern, how to use it, and its limitations.
What is a Hammer Candlestick Pattern?
This candlestick pattern is a bullish reversal single candle pattern, which indicates a downtrend reversal in a stock price. Candlestick generally forms at the bottom of a downtrend, suggesting that sellers are losing control and buyers are about to push prices upwards. This pattern is a powerful technical tool and is used by traders frequently.
Read Also: Introduction to Bearish Candlesticks Patterns: Implications and Price Movement Prediction
Types of Hammer Candlestick Patterns
There are generally two types of candlestick patterns-
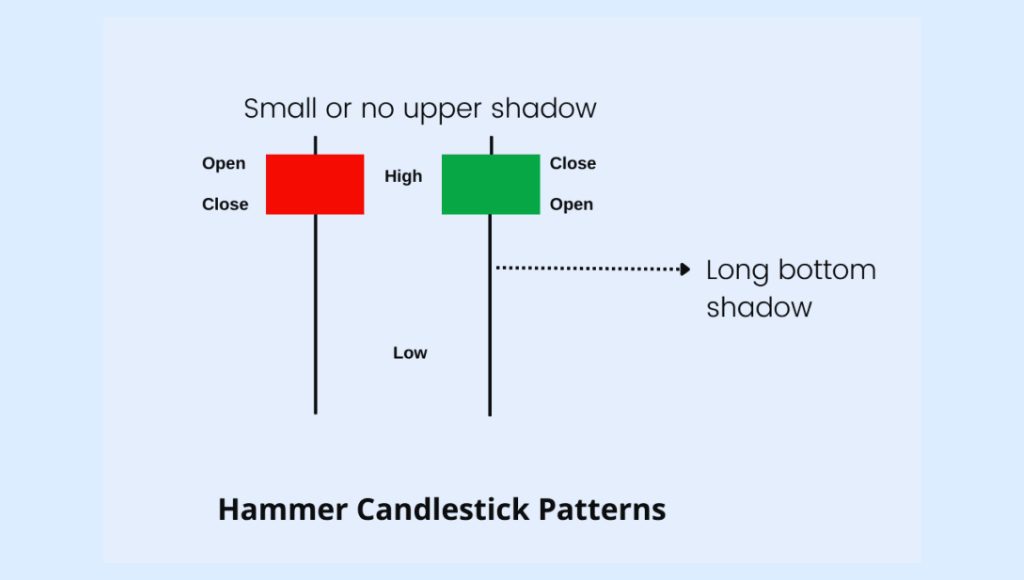
- Classic Hammer: This is the standard form of hammer pattern and generally appears at the bottom of a downtrend. After this, a potential uptrend in the stock price can be seen. This pattern has a small body and a long lower shadow, which is generally twice the size of the body. It suggests a strong rejection of lower prices and allows buyers to enter the rally.
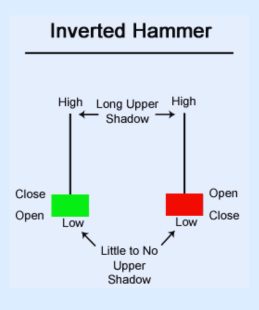
- Inverted Hammer: This candlestick pattern is almost similar to the regular hammer and is flipped upside down. It also appears at the end of a downtrend and has a long upper shadow instead of a lower shadow. It also suggests a potential reversal, although considered less reliable than the classic hammer. It indicates that buyers attempted to take the price high during the session but failed because of resistance.
Features of Hammer Candlestick Pattern
Hammer candlestick pattern has the following features:
- 3The candle can be either bullish or bearish.
- The lower shadow of the candle should be at least twice the length of the body.
- There should be no or little upper shadow, which indicates that the closing price is near the highest price of the session.
Interpretation of Hammer Candlestick Pattern

This reversal pattern generally forms at the bottom of a downtrend and indicates a reversal. The lower shadow suggests that the seller has taken the prices down during the trading session, but due to strong buying pressure, the prices are pushed upwards near the end of the session. The sentiment is turning bullish, indicating that there might be a reversal in price after a downtrend. The importance of a hammer candlestick can be seen in the length of the shadow; the longer the shadow, the higher the chances of reversal.
Advantages of Hammer Candlestick Pattern
Hammer candlestick pattern has the following advantages:
- It acts as a leading indicator, suggesting a shift in momentum.
- A trader can use the shadow’s low for setting a stop-loss, which helps them minimize losses.
Limitations of Hammer Candlestick Pattern
Hammer candlestick pattern has the following limitations:
- Traders consider a hammer candlestick as a potential reversal signal without waiting for proper confirmation.
- These patterns are less effective in volatile market conditions.
- The hammer candlestick pattern does not provide any upside target. Therefore, a trader is required to use other tools to determine potential entry and exit points.
- For a trader, it is sometimes difficult to identify the exact hammer candlestick, as the length of shadow varies, or the candle’s body does not resemble the exact hammer pattern.
Strategy Based on Hammer Candlestick Pattern

Entry Point: A trade can take a long position in stock upon confirming the hammer pattern. But one should take entry once the next candle after the hammer closes above the hammer’s high.
Stop Loss: Typically, a stop-loss should be placed below the low of the hammer candlestick to minimize the risk.
Target: The target is generally set near the next resistance point or as per the trader’s risk-taking capacity.
Difference Between Doji and Hammer Candlestick Pattern
Generally, the Doji and hammer candlestick patterns are considered similar. Still, these two have a few basic differences, as the Doji appears as a small body with long lower and upper shadows. In contrast, the hammer has only a long lower shadow and a long upper shadow in the case of an inverted hammer. While the hammer indicates a bullish reversal pattern, the Doji indicates price reversal or trend continuation.
Read Also: Introduction to Bullish Candlestick Patterns: Implications and Price Movement Prediction
Conclusion
The hammer candlestick pattern is very popular among traders, as it helps them identify the reversal point in a downtrend. However, a trader should wait for a confirmation of the bullish candle following the hammer pattern. It is suggested that a stop loss be placed below the low of the hammer candlestick as it helps them minimize their losses in case of market volatility.
Frequently Asked Questions (FAQs)
01
Is the hammer candlestick a bullish or bearish pattern?
The hammer is a bullish reversal candlestick pattern.
02
How do you identify a hammer candlestick pattern on a chart?
To identify this pattern, a trader must look for a candlestick with a small body at the upper range of the trading session. It should also have a long lower shadow at least twice the length of the body, with little or no upper shadow.
03
Is it possible that the hammer pattern provides a false signal?
Yes, there is a possibility that hammer patterns can produce false signals. Therefore, a trader should use stop loss while executing a trade.
04
Where can you put stop loss while trading a Hammer Candlestick pattern?
Generally, a stop loss should be placed below the low of the Hammer Candlestick.
Disclaimer
The securities, funds, and strategies discussed in this blog are provided for informational purposes only. They do not represent endorsements or recommendations. Investors should conduct their own research and seek professional advice before making any investment decisions.
