
| Type | Description | Contributor | Date |
|---|---|---|---|
| Post created | Pocketful Team | Oct-10-24 |
Read Next![]()
- MCX Trading: What is it? MCX Meaning, Features & More
- Top 10 Intraday Trading Strategies & Tips for Beginners
- How to Use Pivot Points in Intraday Trading?
- What is Intraday Trading?
- Understanding Intraday Trading Timings
- How to Choose Stocks for Intraday the Right Way?
- Blending Candlestick Patterns: How It Works, Benefits & Drawbacks
- Market Order Vs Limit Order: What’s the Difference?
- Silver Futures Trading – Meaning, Benefits and Risks
- What is Crude Oil Trading and How Does it Work?
- Top Algorithmic Trading Strategies of 2025
- What is Paper Gold? – Meaning, Types, & Benefits
- What is Algo Trading?
- What is Tick Trading? Meaning & How Does it Work?
- Rising Window Candlestick Pattern
- Black Candle Pattern
- Piercing Pattern
- High-Wave Candlestick Chart Pattern
- Closing Black Marubozu Candle
- What is the Best Time Frame for Swing Trading?

- Blog
- trading
- candlestick patterns
- homing pigeon
Homing Pigeon Pattern: Examples in Technical Analysis
|
|
Have you heard the quote, “Homing Pigeons always find their way back home”? A Homing Pigeon candlestick pattern is named after the homing pigeon’s ability to find its way back home over long distances. Some research suggests that the Homing Pigeon pattern is a bearish continuation pattern, while others interpret it as a bullish reversal pattern.
In this blog, we will discuss the Homing Pigeon pattern, its interpretation, advantages and limitations. Moreover, we will also provide a trading setup and explain it with the help of a real-world example.
What is a Homing -Pigeon Pattern?
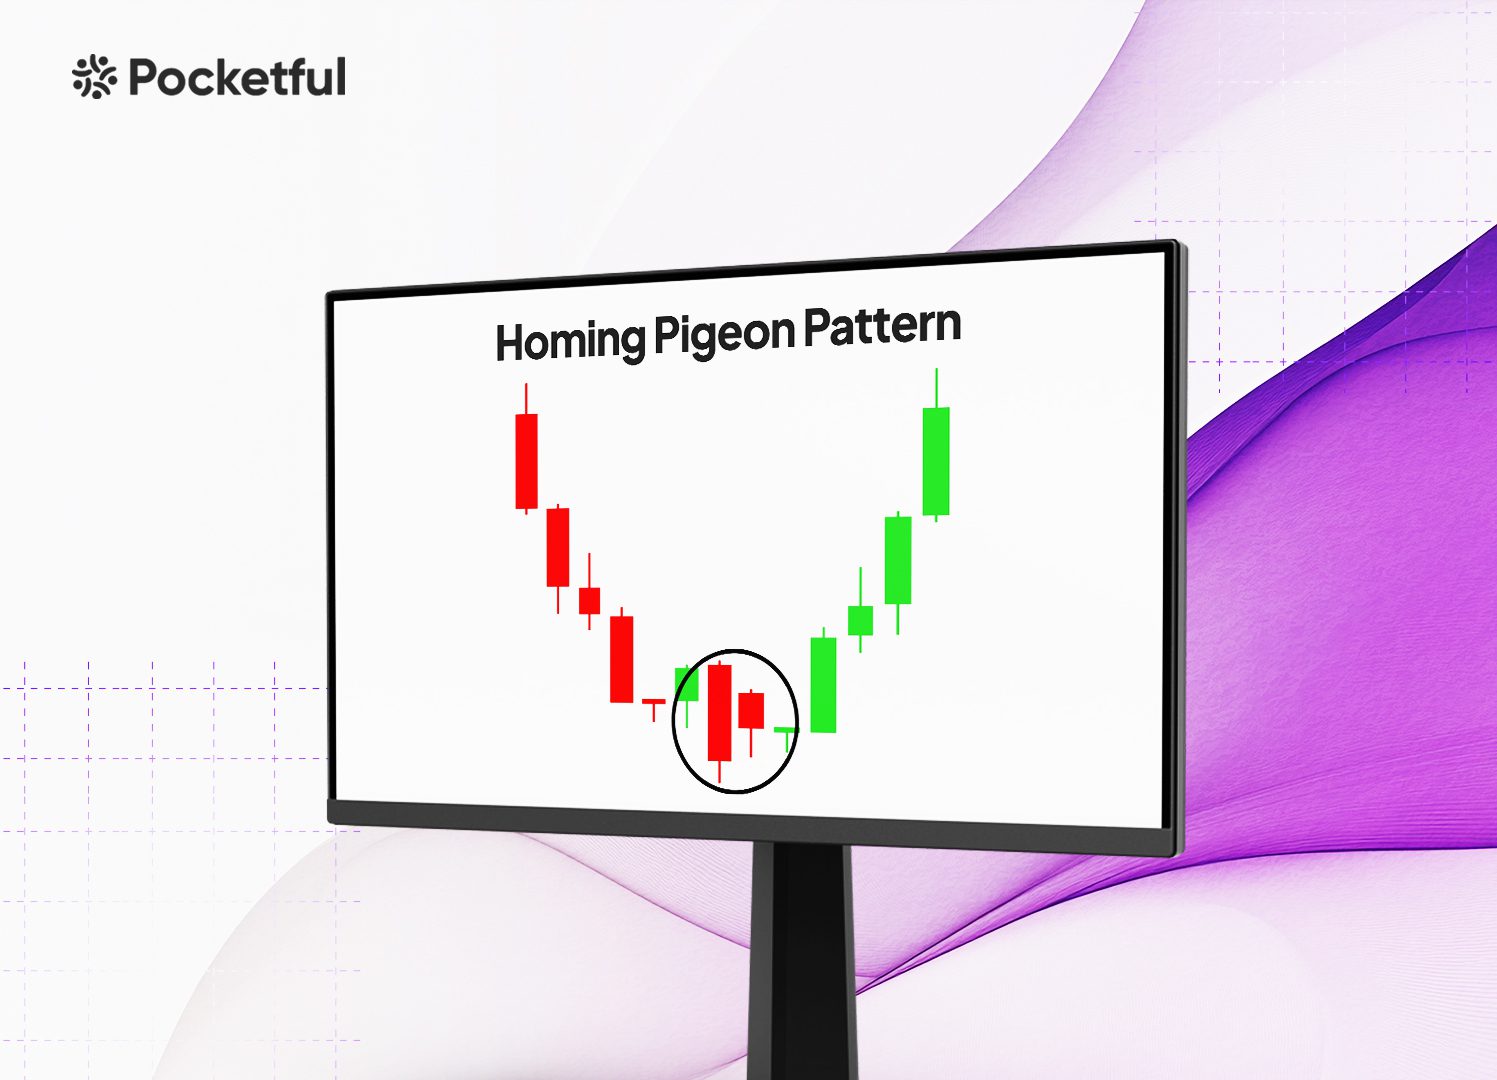
The Homing Pigeon chart pattern is a bullish reversal candlestick pattern. It is a two-candle pattern, which indicates a potential shift from a downtrend to an uptrend. The pattern is a weak reversal indicator due to which it needs confirmation.
The Homing Pigeon pattern is a type of candlestick pattern that can indicate a trend reversal; however, some researchers treat it as a continuation pattern. The pattern is made up of two bearish candles, one with a large body and the other one with a smaller body, which is inside the body of the first candle. The pattern is similar to a homing pigeon finding its way home and can help asset prices return to bullish territory once again.
Read Also: Bullish Tasuki Line Pattern
Characteristics of the Homing Pigeon Pattern
The characteristics of the Homing Pigeon pattern are:
- Formation: The pattern consists of 2 bearish candles. The first candle is a long bearish candle, which indicates strong bearish momentum, and the second candle is a smaller candle, which is completely contained inside of the first candle, suggesting a weakening of the bearish trend and declining selling pressure.
- Market Sentiments: It often occurs near the end of a downtrend and functions as a potential bullish reversal pattern.
- Weak Reversal Signal: Compared to other candlestick patterns like the Engulfing pattern, Homing Pigeon gives a weak reversal signal; hence, confirmation is required, like the size of the third candle and the volume.
- Confirmation: Volume can also be erratic during the formation of the pattern, but during breakout, look for an increase in volume for a strong confirmation signal.
- Breakout: The pattern can give a breakout above the high of the second candle and is generally considered a reversal signal.
- Risk Management: While trading any chart pattern, proper stop-loss placement and risk management strategies are crucial.
Trading Setup
The Homing Pigeon candlestick pattern can be effectively used by following the below trading setup:
- Entry Point: Since it is a reversal pattern, the entry point should be when the price gives a breakout above the high of the second candle and also takes confirmation from the increase in volume.
- Stop-Loss: A stop-loss should be placed ideally below the low point of the second candle. The alternative stop-loss can be placed just below the low of the first candle so that traders can manage risk in case of a false signal.
- Target: Take profit at the nearest significant resistance level, Fibonacci retracement levels or as per your risk and reward ratio.
Example of Homing Pigeon Pattern of Tata Consultancy serv ltd.
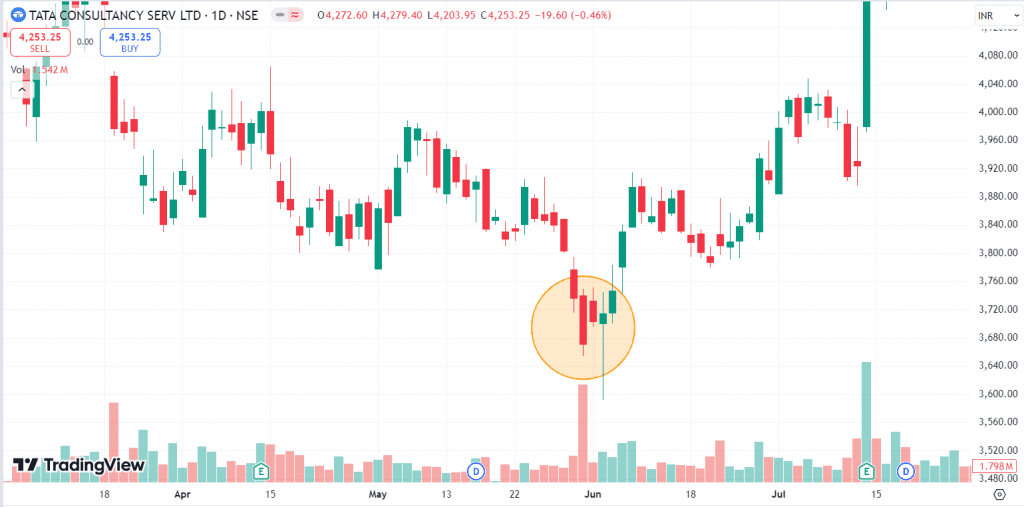
The above image shows the daily chart of Tata Consultancy Services. The stock was in a downtrend, and then it made a big bearish candle on 31 May 2024, when the stock price opened at INR 3,740 and closed at INR 3,670. On the next trading day, the stock price opened at INR 3,732 and closed at INR 3,702, i.e. inside the body of the previous day’s candlestick. The two bearish candles combined to form a Homing Pigeon pattern. The stock gave a breakout above the high of the second candle on 6 June 2024, and the stock price is currently trading at INR 4,253. For trading this pattern, keep the stop-loss below the lowest point of the second candle or more conservatively below the low of the first candle and take profit at the nearest resistance. Traders can also use trailing stop-loss and customized targets based on their risk-reward ratios.
Advantages of Homing Pigeon Pattern
The advantages of using a Homing Pigeon pattern are:
- It works more efficiently in a shorter time frame.
- It is a reliable reversal signal indicator.
- It is easy to identify
- It works well with other indicators.
- It indicates weakening selling pressure.
- This pattern gives a complete setup for stop-loss and target.
- This pattern gives quite accurate results in a trending market with strong volumes.
Limitations of Bearish Homing Pigeon Pattern
The limitations of using a Homing Pigeon pattern are:
- It could give false signals, which can result in losses in sideways markets.
- The pattern usually generates a weak signal that requires confirmation from other technical indicators.
- It is difficult to find as compared to other patterns.
- This pattern is of limited use in low-volume markets.
- It needs confirmation and support from other indicators or studies.
- It works well in the short term as sometimes it indicates reversal for a brief period, and sometimes it indicates continuation.
- This pattern could be affected by various market factors like volatility, news, policy change, political instability, or any other factor.
Conclusion
In conclusion, the Homing Pigeon chart pattern is a bullish reversal candlestick pattern that signals a potential shift from a downtrend to an uptrend. While it is composed of two consecutive bearish candles, the pattern reflects the weakening of selling pressure, which indicates that the downtrend may be losing momentum. While it indicates a potential reversal, it is important to confirm the signal with other technical indicators or volume and use appropriate strategies for risk management, such as stop-losses and target levels, before entering a trade. The pattern usually generates a weak signal; hence, it is very important to understand the pattern’s characteristics, trade setup, and risk management before trading this pattern.
Frequently Asked Questions (FAQs)
What Does the Homing Pigeon Pattern Indicate?
The Homing Pigeon pattern suggests a weakening of the current downtrend and a potential bullish reversal.
Does the Homing Pigeon pattern generate a strong reversal signal?
The Homing Pigeon pattern usually generates a weak (reversal) signal compared to other candlestick patterns. It requires additional confirmation from other technical indicators or must be followed by a bullish candle for a strong buy signal.
Can the Homing Pigeon Pattern fail?
Yes, like any other chart pattern, this pattern can also fail, particularly if market conditions and news are against the pattern’s signal.
What’s the difference between a Homing Pigeon and an Engulfing pattern?
In the Engulfing pattern, the second candle completely engulfs the body of the first candle and signals a strong trend reversal. However, the second candle in the Homing Pigeon pattern is smaller and is engulfed by the first candle, representing a weak reversal signal.
What is the significance of the second candle in the Homing Pigeon pattern?
The second candle has a smaller body, which reflects reduced momentum or indecision during the downtrend. It suggests that selling pressure is weakening, and we still need further confirmation for a trend reversal.
Disclaimer
The securities, funds, and strategies discussed in this blog are provided for informational purposes only. They do not represent endorsements or recommendations. Investors should conduct their own research and seek professional advice before making any investment decisions.