
| Type | Description | Contributor | Date |
|---|---|---|---|
| Post created | Pocketful Team | Oct-01-24 |
Read Next![]()
- MCX Trading: What is it? MCX Meaning, Features & More
- Top 10 Intraday Trading Strategies & Tips for Beginners
- How to Use Pivot Points in Intraday Trading?
- What is Intraday Trading?
- Understanding Intraday Trading Timings
- How to Choose Stocks for Intraday the Right Way?
- Blending Candlestick Patterns: How It Works, Benefits & Drawbacks
- Market Order Vs Limit Order: What’s the Difference?
- Silver Futures Trading – Meaning, Benefits and Risks
- What is Crude Oil Trading and How Does it Work?
- Top Algorithmic Trading Strategies of 2025
- What is Paper Gold? – Meaning, Types, & Benefits
- What is Algo Trading?
- What is Tick Trading? Meaning & How Does it Work?
- Rising Window Candlestick Pattern
- Black Candle Pattern
- Piercing Pattern
- High-Wave Candlestick Chart Pattern
- Closing Black Marubozu Candle
- What is the Best Time Frame for Swing Trading?

- Blog
- trading
- candlestick patterns
- long legged doji
Long-Legged Doji Candlestick Pattern
|
|
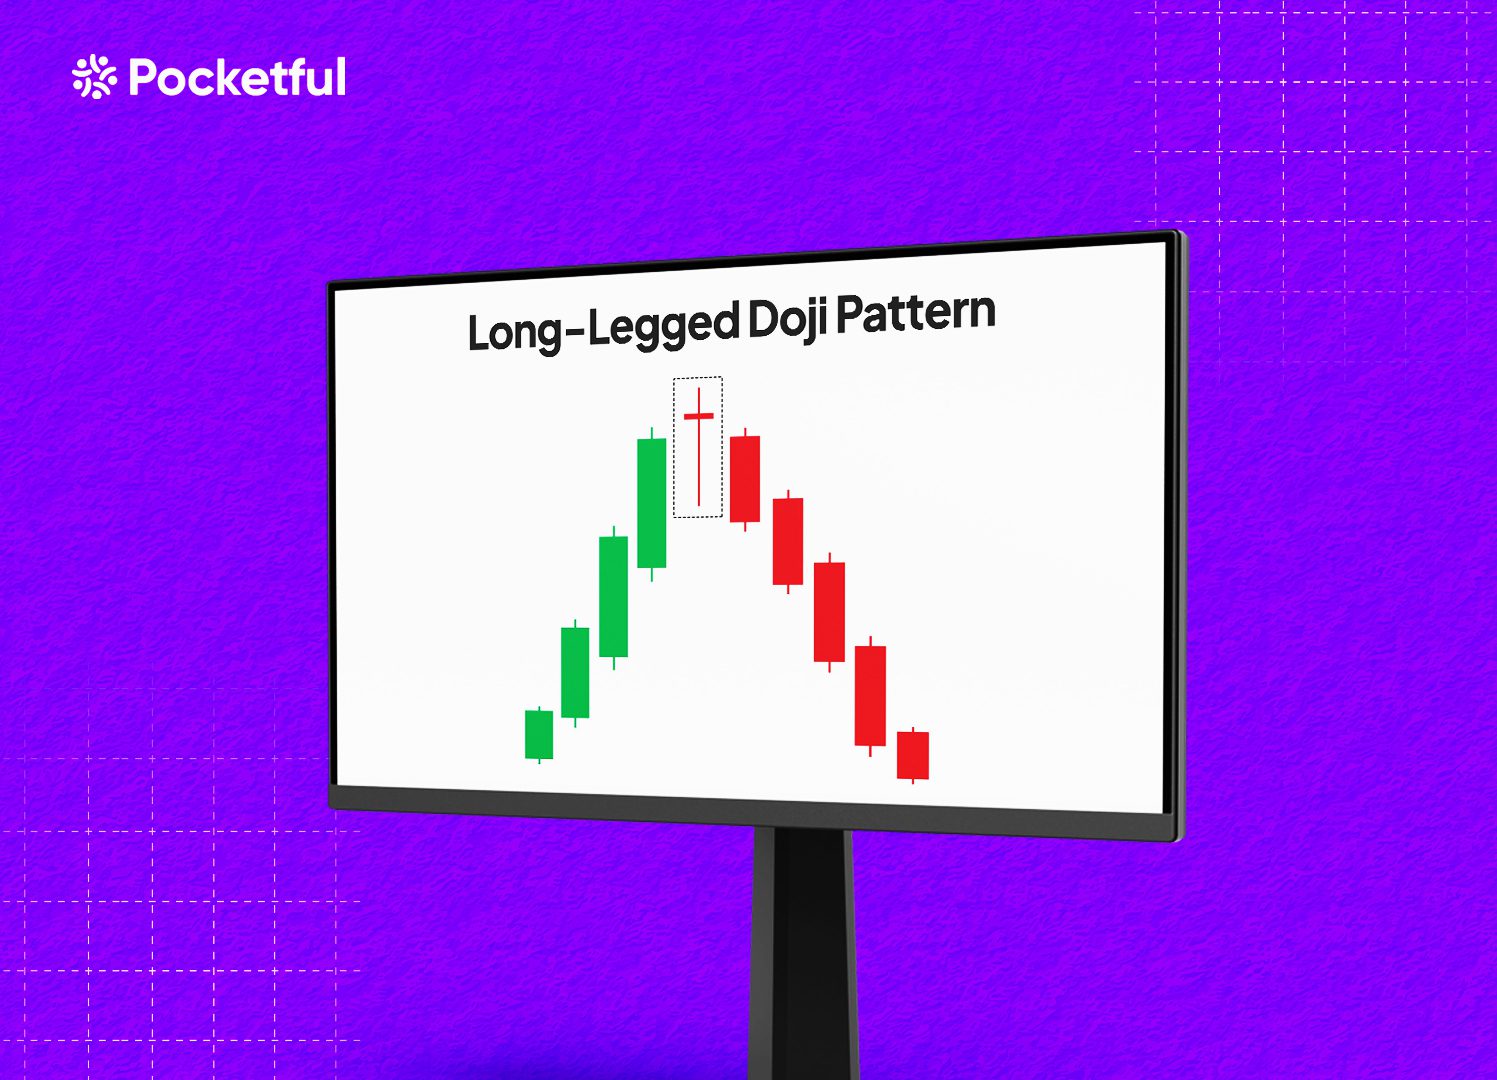
The Long-Legged Doji candlestick represents a situation where the market indecision meets volatility. A Long-Legged Doji is a candlestick pattern usually accompanied by high volatility but ends with no clear winner between bulls and bears. The pattern suggests indecision and can behave both as a reversal or a continuation pattern. Let’s dig deeper into it.
What is a Long-Legged Doji Candlestick Pattern?
A Long-Legged Doji pattern is a type of candlestick pattern that can be observed in a candlestick chart. It is characterized by a long upper and lower shadow (or wick), with a very small or nearly invisible real body. The real body is small because the open and close prices of the asset are very close or equal to each other, indicating high volatility. This pattern reflects that both bulls and bears tried to influence the price of the security during the trading period but ultimately couldn’t push the price in one clear direction.
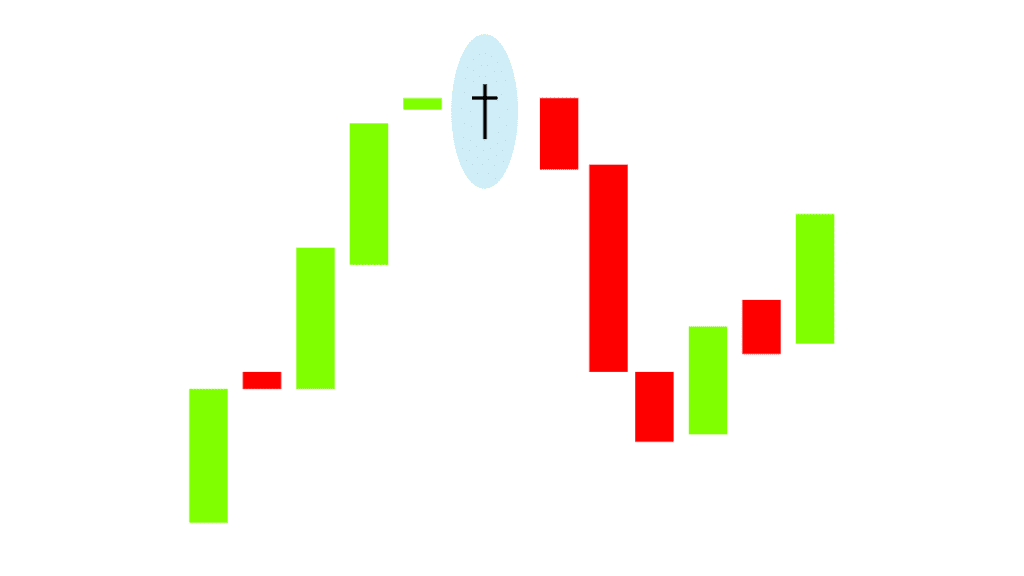
Characteristics of the Long-Legged Doji
The Long-Legged Doji pattern is a candlestick pattern used to identify a state of indecision in the market before the next big move occurs. It unfolds in the following phases:
- A small real body: The real body of the candle is small as both the open and close of the candlestick are nearly identical.
- Long upper and lower shadows: The long wick above and below the real body indicates both volatility and indecision. During the trading session, both the buyers and sellers tried to push the asset price in either direction, but neither of them had substantial influence, and the price closed near the opening price.
- Volatility: The length of the shadows shows high volatility.
- Market indecision: The Long-Legged Doji candlestick indicates that both buyers and sellers were active during the session, but nobody had control.
- Location: The significance of Long-Legged Doji increases when it appears after a strong uptrend or strong downtrend as it signals momentum is weakening.
- Other Considerations: Always wait for confirmation in the form of further price increases or declines after making the Long-Legged Doji candle. Once the next candle gives a breakout above the high or a breakdown below the low of the Doji candle, an individual should check the volumes. High trading volume during a breakdown or breakout confirms the change in trend, after which traders can create long or short positions.
This pattern helps traders recognize when a bullish or bearish trend may have come to an end. After confirmation, traders can create long or short positions.
Trading Setup
The Long-Legged Doji candlestick pattern can be effectively used by following the below trading setup:
- Entry Point: The entry point should be when the price gives a breakout and closes above the Doji candle’s high for a long position or gives a breakdown and closes below the Doji candle’s low for a short position.
- Stop-Loss: A stop-loss should be placed just above the high of the Long-Legged Doji for a short position or just below the low of the Long-Legged Doji candle for a long position.
- Target: The target can be set at the next major support or resistance levels, Fibonacci levels, or traders can use a risk-to-reward ratio such as 1:2, 1:3, etc.
Read Also: Morning Doji Star Candlestick Pattern
Advantages of the Long-Legged Doji Candlestick Pattern
The advantages of using the Long-Legged Doji candlestick pattern are:
- This pattern can be identified in any market, such as equity, currency, or commodity markets.
- The pattern works in any time frame, but a higher time frame means a strong trend reversal is expected.
- It’s one of the popular candlestick patterns.
- It is very easy to identify.
- It indicates market indecision, which can signal a potential change in trend.
- The pattern provides a logical understanding of price action and a complete trading setup.
- The pattern can be used in combination with other indicators.
- The pattern offers both buying or shorting opportunities in the market and a favorable risk-to-reward ratio.
Limitations of the Long-Legged Doji Candlestick Pattern
The limitations of using the Long-Legged Doji candlestick pattern are:
- The pattern doesn’t provide clear bullish or bearish signals and shows indecision in the market.
- The pattern can give false signals in sideways or range-bound markets.
- The pattern could give a false breakout or breakdown and fail like any other chart pattern, which can result in losses.
- This pattern could be affected by various market factors like volatility, news, policy change, political instability, etc.
- The pattern doesn’t always signal a reversal; it could also signal a continuation of the trend.
- The interpretation of a pattern’s signal is context-driven. For example, the pattern’s signal strength is weak if it occurs in the middle of the trend, without strong support and resistance levels nearby.
- It requires confirmation.
Example of Long-Legged Doji Pattern of Shakti Pumps Ltd:
Long-Legged Doji candlestick pattern example of Shakti Pumps Ltd.
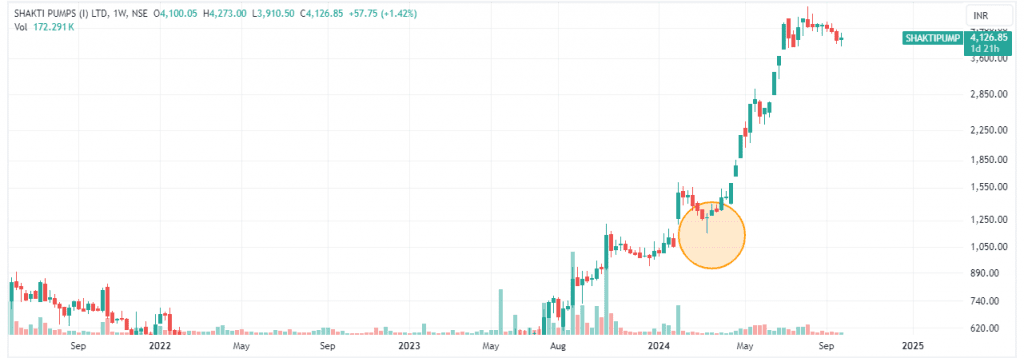
The above image shows the weekly chart of Shakti Pumps Ltd. The stock was in an uptrend from May 2023 to January 2024, but then it faced resistance and came down a bit. The stock made a Long-Legged Doji chart pattern in March 2024, which depicted market indecision. Within the next few weeks, the stock price gave a breakout above the high of that Doji candle and closed above it. The stock price took support from INR 1,150 levels, which after the breakout became a strong support level. It confirmed the continuation of the trend, and the stock went up from the high of the Long-Legged Doji, which was around INR 1300, to INR 3000 in just two months and is trading at INR 4,067 as of 27 September 2024. The target zone can be marked near major resistance levels or Fibonacci levels. Stop-loss should be placed just below the Long-Legged Doji candle’s low. Traders can trail stop-loss once stock starts to go up.
Read Also: Dragonfly Doji Pattern
Conclusion
The Long-Legged candlestick pattern is a popular and powerful technical tool for investors and traders alike. The pattern involves a Long-Legged Doji candle, which indicates indecision and depends on the next candle for confirmation. The real body of the Doji candle is so small that the asset price closes near the open of the candle. The Long-Legged Doji can be a valuable tool for detecting potential trend changes, but it must be used carefully and in conjunction with other technical indicators because it may generate false signals in the sideways market or due to sensitive news. Hence, it is very important to understand the pattern’s characteristics, trade setup, risk management, and strategies before trading this pattern. It is advised to consult a financial advisor before trading.
Frequently Asked Questions (FAQs)
Does a Long-Legged Doji always signal a reversal?
No, it doesn’t always signal a reversal. Sometimes, it can signal a continuation of the current trend. Hence, confirmation from the next candle is important before making any trading decision.
Where is a Long-Legged Doji pattern most effective?
The pattern is most effective when it appears at the end of a trend. The candlestick could appear at the top of an uptrend, the bottom of a downtrend, or near key support or resistance levels.
What does a Long-Legged Doji indicate?
It indicates indecision in the market as both buyers and sellers are unable to control the direction of the asset price. It can indicate that the current trend is losing momentum and that a reversal or consolidation is expected.
What is the difference between a Doji and a Long-Legged Doji?
A regular Doji has small or nonexistent upper and lower shadows and looks like a plus sign, indicating very little movement during the session. A Long-Legged Doji has longer upper and lower shadows, showing that there was much more volatility during the session before the price settled near the open.
Where should the stop-loss be placed for the Long-Legged Doji candlestick pattern?
Stop-loss can be placed just above the high of the Long-Legged Doji candle in case of a short position or just below the low of the Long-Legged Doji in case of a long position.
Disclaimer
The securities, funds, and strategies discussed in this blog are provided for informational purposes only. They do not represent endorsements or recommendations. Investors should conduct their own research and seek professional advice before making any investment decisions.