
| Type | Description | Contributor | Date |
|---|---|---|---|
| Post created | Pocketful Team | Sep-20-24 |
Read Next![]()
- MCX Trading: What is it? MCX Meaning, Features & More
- Top 10 Intraday Trading Strategies & Tips for Beginners
- How to Use Pivot Points in Intraday Trading?
- What is Intraday Trading?
- Understanding Intraday Trading Timings
- How to Choose Stocks for Intraday the Right Way?
- Blending Candlestick Patterns: How It Works, Benefits & Drawbacks
- Market Order Vs Limit Order: What’s the Difference?
- Silver Futures Trading – Meaning, Benefits and Risks
- What is Crude Oil Trading and How Does it Work?
- Top Algorithmic Trading Strategies of 2025
- What is Paper Gold? – Meaning, Types, & Benefits
- What is Algo Trading?
- What is Tick Trading? Meaning & How Does it Work?
- Rising Window Candlestick Pattern
- Black Candle Pattern
- Piercing Pattern
- High-Wave Candlestick Chart Pattern
- Closing Black Marubozu Candle
- What is the Best Time Frame for Swing Trading?

- Blog
- trading
- candlestick patterns
- morning doji star
Morning Doji Star Candlestick Pattern
|
|
The Morning Doji Star candlestick pattern is a powerful pattern that can provide insights into possible market reversals. This pattern can help traders enhance their ability to identify and capitalize on market turning points.
In today’s blog, we will explore the fascinating intricacies of this pattern, learning about its formation, interpretation, and the trading implications it holds.
What is the Morning Doji Star Candlestick Pattern?
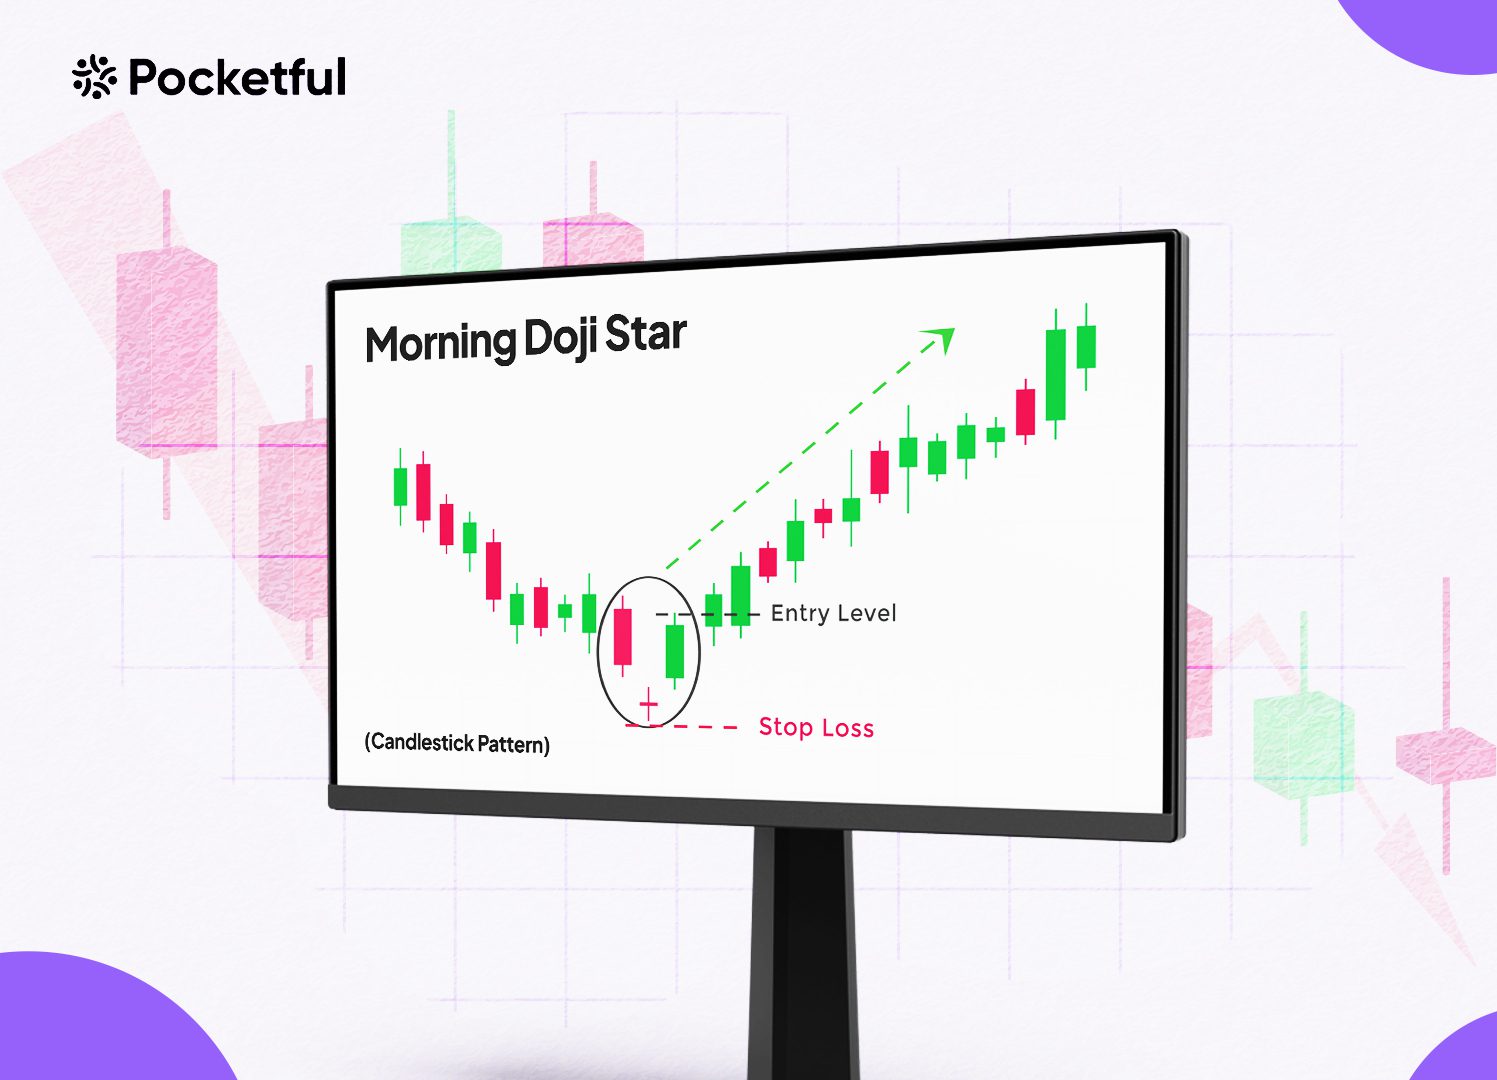
Morning Doji Star candlestick pattern consists of three candlesticks, indicating a likely bullish trend reversal within a downtrend. The first candle shows a price decline, the second candle is a Doji candle, and the third candle confirms the bullish reversal. When the pattern is formed, traders often interpret that selling pressure may be easing, as evidenced by the long lower shadow of the second candle in the pattern. Traders use this pattern to anticipate a shift in market sentiment and consider entering long positions.
Additionally, the neutral stance of the Doji candle makes the Morning Doji Star a more accurate reversal pattern than the traditional Morning Star candlestick pattern. However, waiting for further confirmation, such as a higher high on the following candle, is highly recommended before entering a trade.
Interpretation
It consists of three candlesticks. The first candle is a long, bearish candle, showing strong selling pressure. The second candle is a small-bodied candle that opens lower than the close of the previous candle and closes as a small-bodied candle, signifying indecision in the market. This is followed by a third candle that closes above the midpoint of the first candle, indicating a potential bullish reversal. This pattern is generally seen at the end of the downtrend and can indicate a possible buying opportunity.
Read Also: Dragonfly Doji Pattern
How to Determine Target and Stop-loss?
A commonly used method to calculate the target price involves determining the downtrend’s length before the appearance of the Doji candle. This measure can be added to the reversal point to get a target price for the upcoming uptrend. Fibonacci retracements can also help traders recognize possible price targets.
Read More about Fibonacci Retracement
To avoid huge losses, it is advisable to position the stop-loss order slightly below the lowest point of the Doji candlestick. Stop-loss can help prevent losses if the reversal fails and the downtrend continues.
Additionally, you can also consider your desired risk-reward ratio. For example, if you are comfortable with a 2:1 risk-reward ratio, your stop-loss should be set twice the distance from your entry point as your target.
Example of Morning Doji Star Pattern
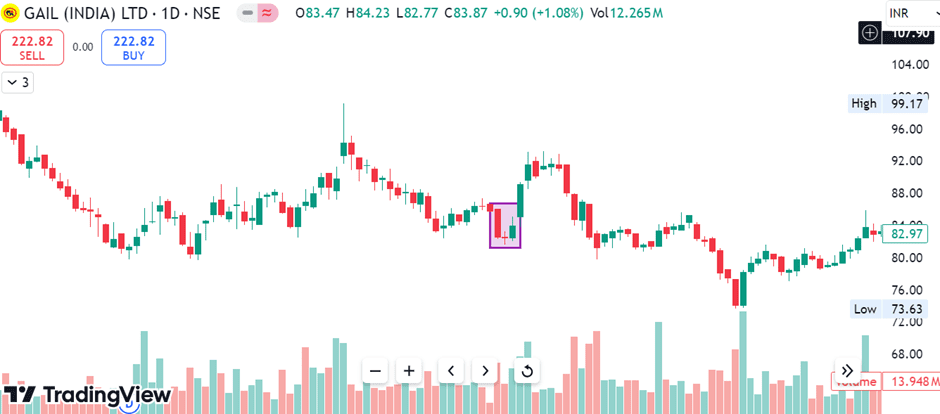
The above image shows the chart of GAIL (INDIA) LTD. on a daily time frame, and a clear formation of the Morning Doji Star candlestick pattern can be seen. A long-bodied red candle is formed after a significant downtrend, followed by a Doji candle. A third bullish candle is formed, indicating a bullish reversal has occurred, and pattern formation is complete.
Advantages of Morning Doji Star Pattern
The advantages of using the Morning Doji Star candlestick pattern are:
- Strong Reversal Signal – The Morning Doji star pattern can be interpreted as a strong bullish reversal signal. When a robust downtrend is followed by a Doji candle and then a bullish candle, it indicates a major change in market sentiment.
- Simple to use– The pattern is easy to spot and understand, which is helpful for both experienced and new traders.
- Reliability – Although not entirely reliable, the Morning Doji Star holds a good track record of effectively anticipating bullish reversals.
Limitations of Morning Doji Star Pattern
Limitations of using the Morning Doji Star candlestick pattern are:
- False Signals – The pattern can sometimes give false signals, like any other chart pattern.
- Confirmation Needed—The Morning Doji Star is commonly seen as an initial indicator. Before entering a trade, it is generally advised to wait for further confirmation, such as a subsequent candle reaching higher high or other technical tools such as volume, RSI, etc.
- Timeframe Sensitivity—The Morning Doji Star candlestick pattern is more reliable in some time frames. It works better in recognizing short-term reversals on intraday charts than long-term trends on weekly or monthly charts.
Read Also: Long-Legged Doji Candlestick Pattern
Conclusion
The Morning Doji Star pattern is an invaluable technical analysis tool that allows traders to easily pinpoint possible reversals in downtrends. Morning Doji Star candlestick patterns can be combined with other indicators to get valuable insights. In addition to the pattern, traders should also pay attention to volume data and support/resistance levels to confirm potential trend reversals and price targets. Comprehensive analysis and a multi-dimensional approach can provide a more reliable basis for trading decisions in a dynamic market environment. However, it is advised to consult a financial advisor before investing.
Frequently Asked Questions (FAQs)
Should I enter a trade immediately after seeing a Morning Doji Star candlestick?
It is often recommended to wait for additional confirmation, such as a higher high on the following candle, or other technical tools, such as volume, RSI, etc., to increase the chances of success.
Can the Morning Doji Star candlestick pattern give false signals?
The Morning Doji Star candlestick pattern can give false signals of a bullish reversal due to different market factors such as volatility, low volumes, etc.
Are there any candlestick patterns similar to the Morning Doji Star?
Yes, the Evening Doji Star is similar to the Morning Doji Star candlestick pattern. However, Evening Doji Star is used to predict a bearish reversal, and Morning Doji Star predicts a bullish reversal.
When should you enter a trade based on the Morning Doji Star pattern?
A trader can create a long position when the price moves above the previous candle’s high or during a pullback to the Doji’s high.
Can the Morning Doji Star be used to create a 100% accurate trading strategy?
No chart pattern can be 100% accurate, and it is important to use it in conjunction with other tools and risk management strategies to maximize the chances of success.
Disclaimer
The securities, funds, and strategies discussed in this blog are provided for informational purposes only. They do not represent endorsements or recommendations. Investors should conduct their own research and seek professional advice before making any investment decisions.