| Type | Description | Contributor | Date |
|---|---|---|---|
| Post created | Pocketful Team | Dec-13-24 |
Read Next
- What is a Harami Candlestick Pattern?
- What is Average Traded Price in Stock Market
- What is MIS in Share Market?
- 7 Common Mistakes in Commodity Trading New Traders Must Avoid
- Brokerage Charges in India: Explained
- What is a BTST Trade?
- How to Do Algo Trading in India?
- What Is CMP in Stock Market?
- MTF Pledge vs Margin Pledge – Know the Differences
- Physical Settlement in Futures and Options
- List of Best Commodity ETFs in India
- Bullish Options Trading Strategies Explained for Beginners
- Best Brokers Offering Free Trading APIs in India
- Top Discount Brokers in India
- Best Charting Software for Trading in India
- Benefits of Intraday Trading
- What are Exchange Traded Derivatives?
- What is Margin Shortfall?
- What is Central Pivot Range (CPR) In Trading?
- Benefits of Algo Trading in India
- Blog
- trading
- candlestick patterns
- rising window
Rising Window Candlestick Pattern

The process of investing in the stock market has drastically evolved over the past few years. A good understanding of market trends can help you capitalize on investing and trading opportunities. Knowledge about chart patterns plays a key role in identifying market trends. The Rising Window candlestick pattern is one such pattern that has a high accuracy in predicting bullish trends.
In this blog, we will try to understand the Rising Window pattern, its interpretation, benefits and disadvantages. Also, we will discuss a trading setup that can be used to make trading decisions based on this chart pattern.
What is the Rising Window Candlestick Pattern?
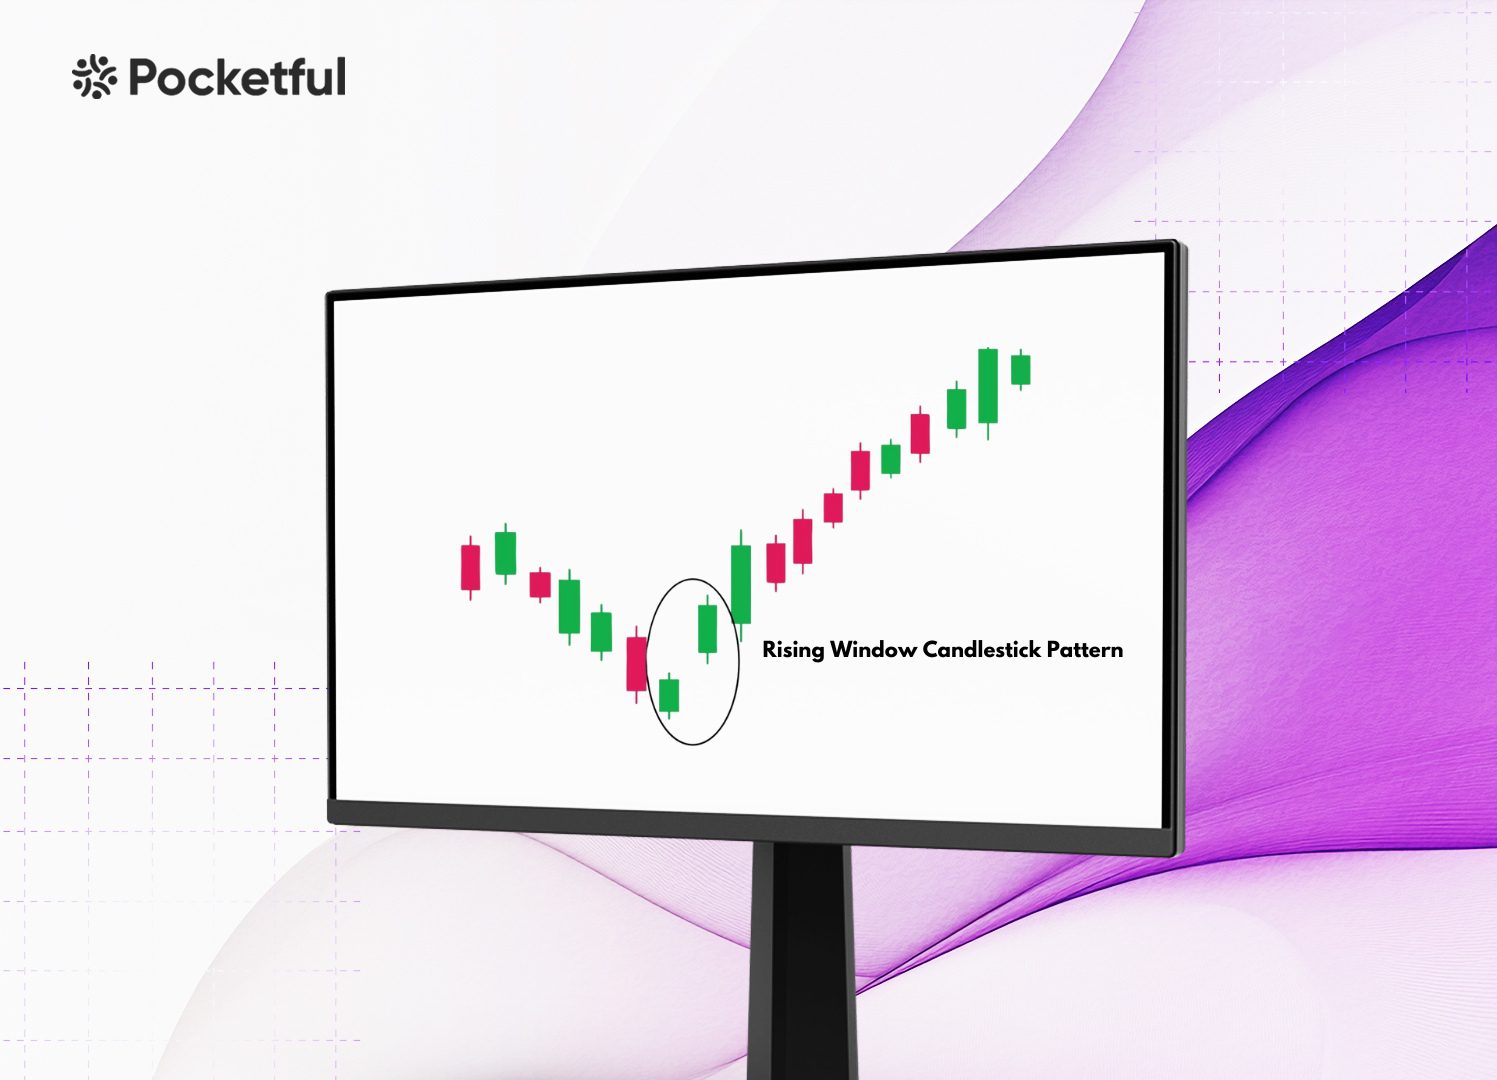
The Rising Window pattern is a bullish continuation chart pattern that forms during the bullish trend. It reflects a bullish continuation, signalling to traders that the buying pressure is dominant in the market and the price will increase. A typical rising window pattern appears as follows:
- The first candlestick is bullish and represents a regular trading session, where the price closes at or near the high.
- The second candlestick low is higher than the previous session’s high, creating a gap between the two candlesticks.
Its structure features no overlap between the two candlesticks, creating a window-like gap between the two. This “window” between the first and second candlestick gives the pattern its name. Sometimes, this pattern can occur in a downtrend, near a support zone, and signal a bullish reversal.
Interpretation
Understanding the patterns is an essential to trade profitably as it not only helps you anticipate the market trends but also helps you make your strategies. In the Rising Window pattern, the gap that forms between the two candlesticks reflects a significant bullish sentiment. This reflects that buyers have complete control of the market.
It is often considered a continuation pattern. In an uptrend, it demonstrates that the bulls have control over the trend, and further upward movement is likely. On the other hand, in a downtrend, the appearance of this pattern could mark a potential reversal, suggesting that bulls are stepping in to challenge the bears.
Key Characteristics:
- Bullish Sentiment: The pattern shows that buyers are dominant.
- Support and Resistance: The gap itself becomes a support zone, and traders usually expect prices to remain above the gap, reinforcing bullish expectations.
- Volume Confirmation: High trading volume during the formation of the second candlestick adds more validity to the pattern, confirming that a substantial number of participants are supporting the bullish price move.
How to Determine Target and Stop-Loss?
Before trading based on a chart pattern, it is important to determine targets and stop-loss. If you are using the Rising Window pattern, these steps can help you set a target or stop-loss.
Setting the Target
You can use the below-mentioned ways to set a target:
- Previous resistance levels: Identify the next major resistance level and set a target price near it. It is possible that the bullish move starts fading near the resistance level.
- Fibonacci Extensions: These extensions are used in trading and investing to identify potential price targets.
- Measured Move: The size of the gap can also be used to estimate a target. Project the gap upwards from the close of the second candlestick to set a target price.
Setting the Stop-Loss
Stop-losses should be placed strategically to protect your capital if the pattern fails.
- Below the Gap: A common approach is to place the stop-loss just below the lower boundary of the gap. If the price falls below this level, it suggests that the gap support has been breached, and the bullish momentum may be weakening.
- ATR (Average True Range): The ATR indicator can help set a dynamic stop-loss. By multiplying the ATR value by a factor of 1.5 or 2, traders can place a stop-loss that reflects current market volatility.
Risk-Reward Ratio
It is advisable to ensure that your risk-reward ratio is favourable before entering the trade. A typical ratio of 1:2 or higher is recommended.
Example of the Rising Window Candlestick Pattern

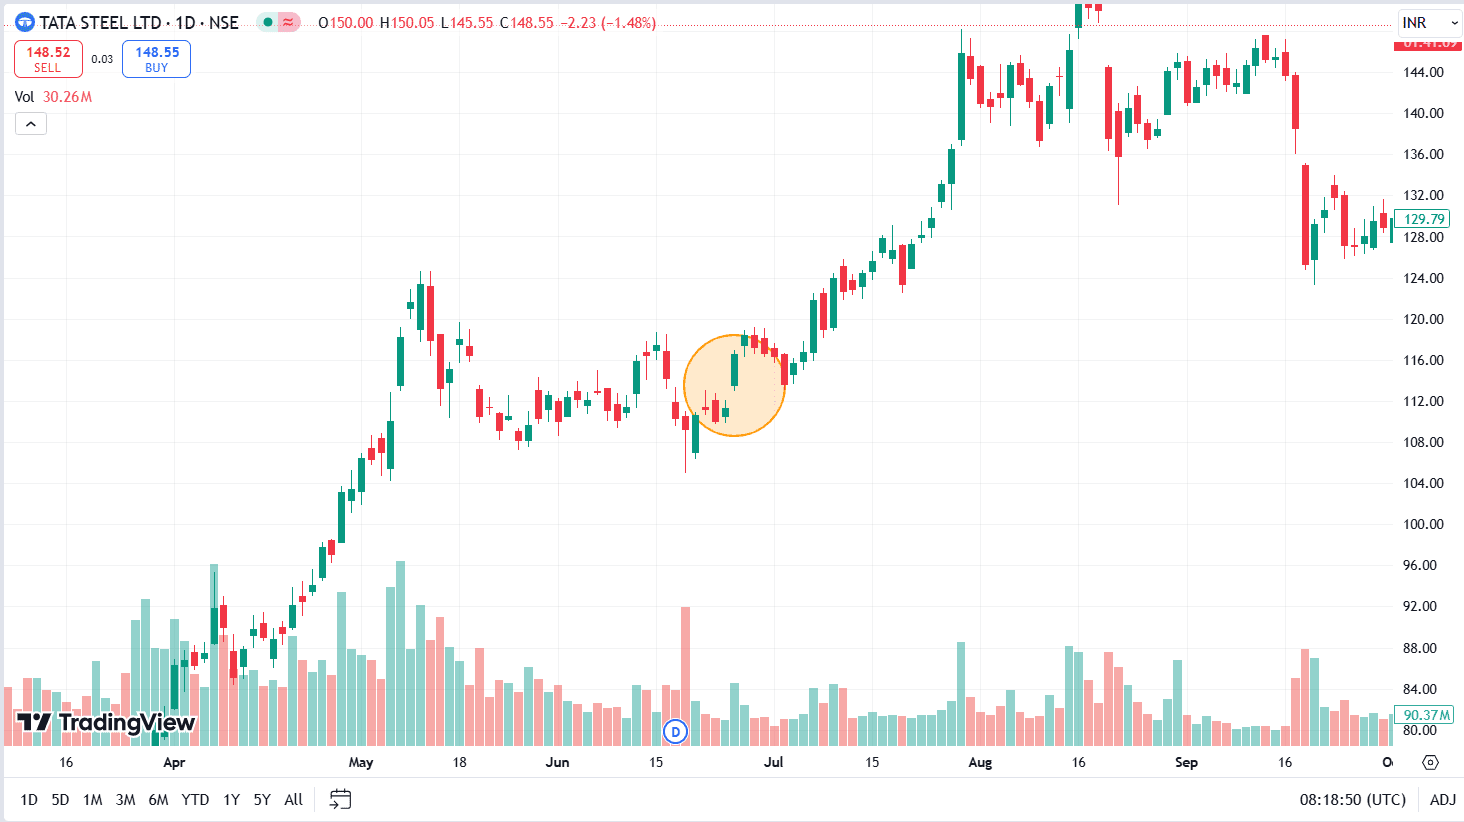
The above image shows the chart pattern of Tata Steel on a daily time frame. The stock was in an uptrend and then entered a consolidation phase between 6 May 2021 and 23 June 2021. The stock made a Rising Window pattern on 25 June 2021 and increased from ₹116 to ₹145 in just over a month.
Read Also: Black Candle Pattern
Advantages of the Rising Window Candlestick Pattern
The Rising Window candlestick pattern may offer you several benefits:
- Strong Bullish Signal: The gap between the two candlesticks serves as a clear indication of bullish sentiment. It can help you spot potential buying opportunities.
- Reliable Support: The gap itself acts as a support level, making it easier to determine stop-loss levels and manage risk.
- Trend Continuation: In an ongoing uptrend, the pattern confirms that the upward momentum is likely to continue.
Limitations of the Rising Window Candlestick Pattern
Every candlestick pattern has its own limitations, and so does the Rising Window pattern. Understanding these limitations can help you make better trading decisions.
- False Signals: Rising Window pattern can sometimes give false signals, particularly in volatile markets where gaps may close quickly, resulting in losses.
- Gap Filling: Gaps are often “filled,” meaning the price may retrace and fill the gap before continuing its upward move. This could trigger the stop-loss and result in a loss.
- Market Context: The Rising Window pattern is most effective in trending markets. In a sideways or choppy market, it may not offer reliable signals.
Conclusion
The Rising Window candlestick pattern is a valuable tool for a trader trying to predict a bullish move. By understanding the mechanics behind the pattern and using additional technical tools like volume indicators and Fibonacci levels, you can enhance your ability to spot profitable opportunities.
When used correctly, the pattern can serve as a powerful signal for predicting a bullish trend. However, like all technical tools, it is essential to combine the pattern signal with other indicators and risk management strategies to minimize losses and maximize profits. Discipline and practice are key to mastering the pattern and using it effectively in real-world scenarios. It is advised to consult a financial advisor before trading.
Frequently Asked Questions (FAQs)
What is the Rising Window candlestick pattern?
The Rising Window is a candlestick pattern that consists of two bullish candlesticks with a gap between the two. This gap signifies bullish momentum in the market, indicating a potential continuation of an uptrend or a bullish reversal in a downtrend.
How does the Rising Window pattern indicate market sentiment?
The gap formed between the two candlesticks represents a surge in buying pressure, reflecting strong bullish sentiment. It shows that buyers have gained control and are pushing the price higher.
What are the key factors to consider when using the Rising Window pattern?
To incorporate this pattern into your trading strategy, you should consider the length of the gap, volume analysis and other market conditions. Determine a stop-loss and target before entering the trade.
How can I determine a target and stop-loss when trading the Rising Window pattern?
Targets can be set using previous resistance levels, Fibonacci extensions, etc. A stop-loss is commonly placed just below the gap’s lower boundary or using a dynamic approach like the ATR (Average True Range) indicator to reflect market volatility.
Can the Rising Window pattern result in false signals?
Yes, like all technical patterns, this pattern can produce false signals. You can combine the pattern signal with some other indicators for better accuracy.
Disclaimer
The securities, funds, and strategies discussed in this blog are provided for informational purposes only. They do not represent endorsements or recommendations. Investors should conduct their own research and seek professional advice before making any investment decisions.
Article History
Table of Contents
Toggle