
| Type | Description | Contributor | Date |
|---|---|---|---|
| Post created | Pocketful Team | Sep-26-24 |
Read Next![]()
- MCX Trading: What is it? MCX Meaning, Features & More
- Top 10 Intraday Trading Strategies & Tips for Beginners
- How to Use Pivot Points in Intraday Trading?
- What is Intraday Trading?
- Understanding Intraday Trading Timings
- How to Choose Stocks for Intraday the Right Way?
- Blending Candlestick Patterns: How It Works, Benefits & Drawbacks
- Market Order Vs Limit Order: What’s the Difference?
- Silver Futures Trading – Meaning, Benefits and Risks
- What is Crude Oil Trading and How Does it Work?
- Top Algorithmic Trading Strategies of 2025
- What is Paper Gold? – Meaning, Types, & Benefits
- What is Algo Trading?
- What is Tick Trading? Meaning & How Does it Work?
- Rising Window Candlestick Pattern
- Black Candle Pattern
- Piercing Pattern
- High-Wave Candlestick Chart Pattern
- Closing Black Marubozu Candle
- What is the Best Time Frame for Swing Trading?

- Blog
- trading
- candlestick patterns
- three black crows
Three Black Crows Chart Pattern
|
|
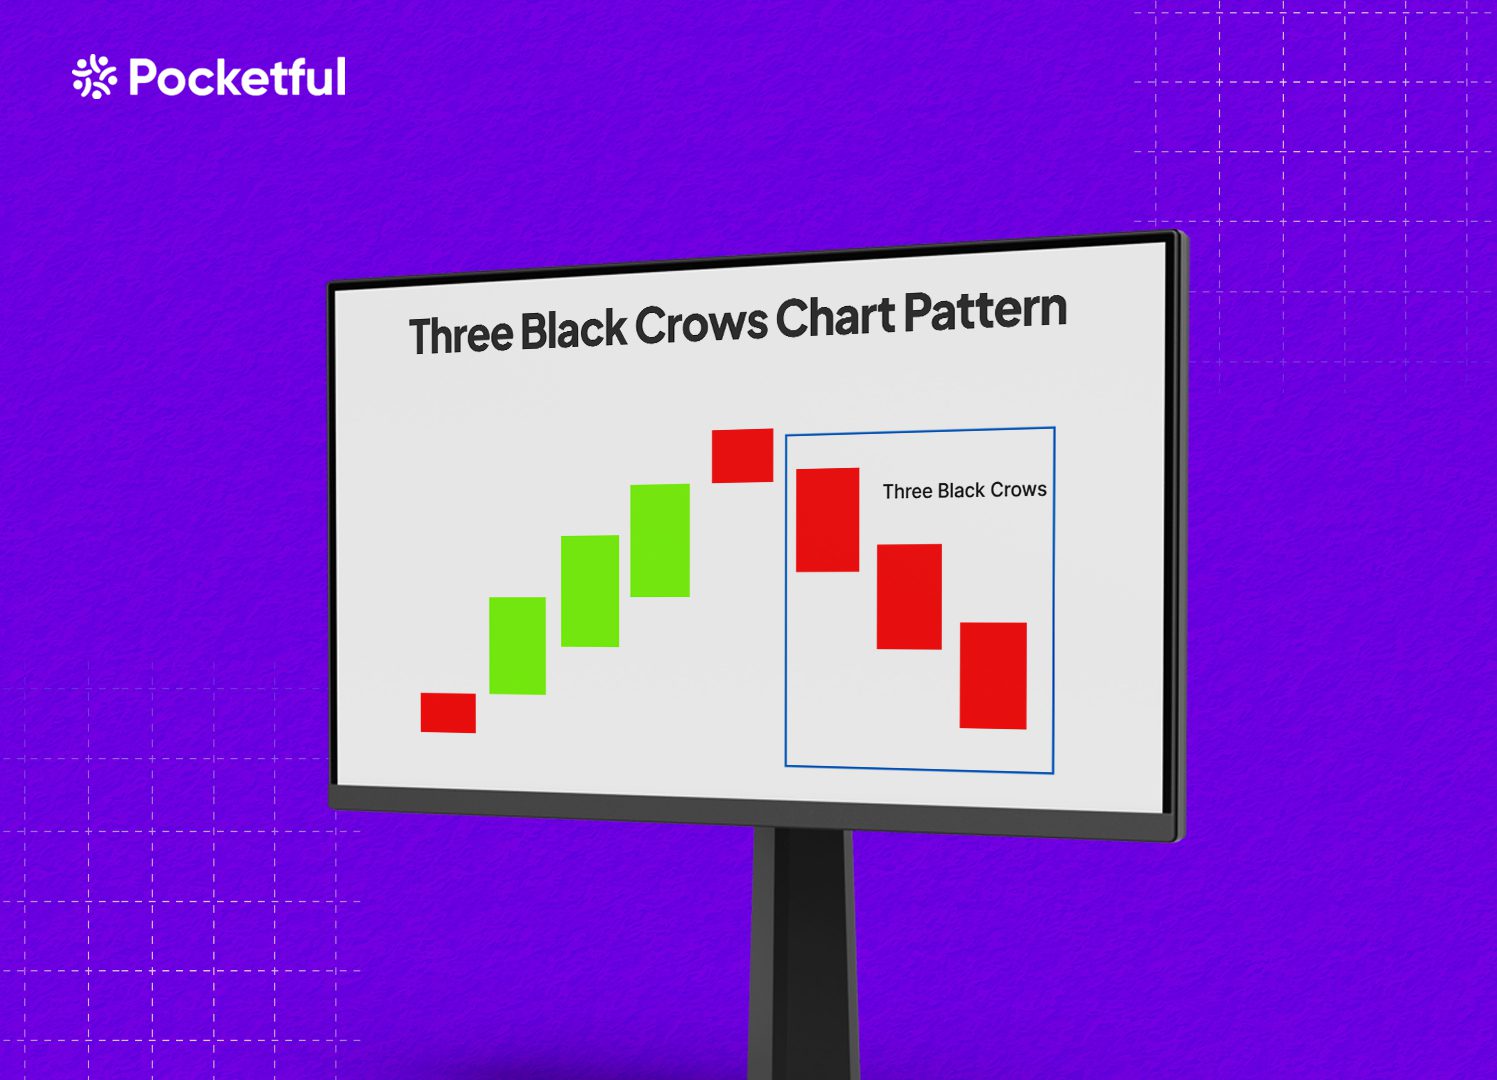
“When the Crows Meet, the Bulls Flee” can be an apt description of the Three Black Crows chart pattern as it represents consistent selling pressure indicated by three consecutive bearish candles that drive the asset price downwards.
In this blog, we will explore the Three Black Crows pattern, signifying the end of a bullish rally and the beginning of the bearish trend. We will discuss the pattern’s characteristics, advantages, and limitations with an example.
What Is a Three-Black Crows Chart Pattern?
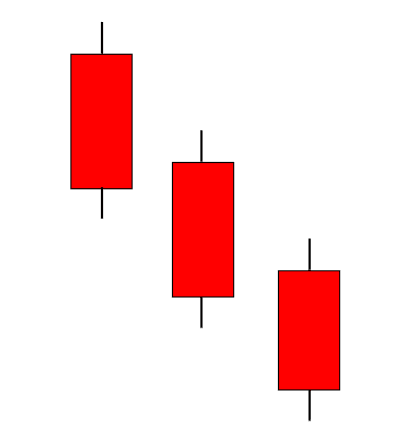
Three Black Crows is a bearish reversal pattern that forms after a bull run. It signals a potential shift in trend and generally appears at the top of an uptrend. It is a candlestick pattern consisting of three consecutive bearish candles, with the second and third candles closing below the low of the preceding candle, indicating consistent selling pressure. It is one of the key reversal patterns and can be observed in candlestick charts.
Characteristics of the Three Black Crows
The Three Black Crows chart pattern is a candlestick pattern used to identify a potential reversal from an uptrend to a downtrend. It unfolds in these phases:
- An Uptrend preceding the pattern: The pattern is valid only if it appears after an uptrend, signaling a possible reversal.
- Three Candle Pattern: It’s a chart pattern that consists of three consecutive bearish candles.
- Formation: It generally forms after a long uptrend and indicates a possible trend reversal.
- Opening Within the Previous Candle’s Body: Each candle opens within the body of the previous candle.
- Lower Closes: Each candle closes slightly lower than the previous one and near the day’s low, which shows strong selling pressure and little to no attempts by buyers to push prices higher.
- No Significant Lower Shadows: The candles generally have small to no lower shadows, indicating that bears are in control throughout the trading period.
- Psychology: Three bearish candles show that the sellers are in control now, and the trend will change.
- Other Considerations: Always wait for confirmation in the form of further price decline after the formation of the Three Black Crows pattern. A high trading volume during the breakdown below the pattern’s third candle confirms the change in trend.
This pattern helps traders recognize when a bullish trend may have come to an end, offering opportunities to exit long positions or to enter short positions.
Trading Setup
The Three Black Crows candlestick pattern can be effectively used by following the below trading setup:
- Entry Point: The entry point should be when the price breaks and closes below the third bearish candle and when additional bearish confirmation appears. Traders can create a short position after confirmation, such as an increase in volume.
- Stop-Loss: A stop-loss should be placed ideally just above the high of the first candle of the Three Black Crows Pattern. Stop-loss helps in reducing losses if the price gives a false breakdown.
- Target: The target can be set at the next major support level, Fibonacci support levels, etc.
Read Also: Three-Line Patterns
Advantages of the Three Black Crows pattern
The advantages of the Three Black Crows pattern are:
- The pattern works well in any market, such as equity, currency, or commodity markets.
- It works in any time frame, but a bigger time frame means a strong trend reversal is expected.
- It’s one of the popular candlestick patterns.
- It is very easy to identify.
- The pattern is a reliable reversal signal indicator, as three consecutive bearish candles signify sustained selling pressure.
- The pattern provides a logical understanding of price action and a complete trading setup.
- The pattern can be combined with other indicators to get confirmation.
- The pattern offers an opportunity to create short positions or exit long positions in the market and offers a favorable risk-to-reward ratio.
- This pattern gives quite accurate results if the breakdown occurs with strong volumes.
Limitations of the Three Black Crows pattern
The limitations of the Three Black Crows pattern are:
- The pattern can give false signals in the sideways market.
- The pattern could give a false breakdown and fail like any other chart pattern, which can result in losses.
- This pattern could be affected by various market factors like volatility, news, policy change, political instability, or other factors.
- The pattern’s reversal signal requires confirmation from other indicators for better accuracy.
- The pattern can be used to predict a temporary decline and not a long-term trend.
Example: Three Black Crows chart pattern of Raymond
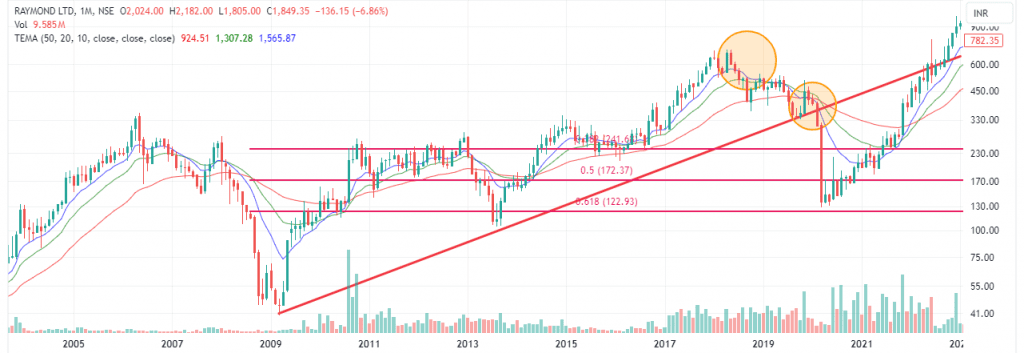
The above image shows Raymond’s monthly price chart. The stock was in an uptrend from 2009 to 2018, after which it made the Three Black Crows chart pattern twice, and both times, the stock price declined. The stock price again made a Three Black Crows pattern in 2019, and a very strong confirmation signal can be seen as the stock price gave a breakdown below a strong trendline of 10 years. Additionally, we can see a death cross on three moving averages, which further confirms the pattern. The stock made a high of INR 509 in November 2019 and declined and made a low of INR 128 in March 2020. The stock was near a crucial support level of INR 115-120 and a Fibonacci level of 61.8%, which was around INR 122; an individual could have used these levels as potential target levels. The target zone is marked at the Fibonacci Levels or nearest major support points. The stop-loss should be placed just above the high of the first candle of the Three Black Crows pattern, and as the stock price declines, stop-loss should be trailing.
Conclusion
The Three Black Crows candlestick pattern is a popular, simple, and powerful technical tool for investors and traders alike. It consists of three bearish candles, with each candle opening within the body of the previous candle closing near the low with no significant lower shadows, showing strong selling pressure. It signals a potential trend reversal in the security price from bullish to bearish. Look for the confirmation, such as volume spike, to get a reliable and strong breakdown signal. It is popular because of its simplicity but has limitations, such as false signals in sideways markets, short-term time frames, etc. Hence, it is very important to understand the pattern’s characteristics, trade setup, risk management, and strategies before using this pattern. It is advised to consult a financial advisor before trading.
Frequently Asked Questions (FAQs)
Can external factors affect the reliability of the Three Black Crows pattern?
Yes, external factors like news, economic data releases, results, or any other major social, economic, or political events can impact the effectiveness of the pattern.
Can the Three Black Crows pattern be used with other Indicators?
Yes, it is recommended to use the Three Black Crows pattern in conjunction with other technical indicators like the Relative Strength Index (RSI), MACD, or Fibonacci retracement for enhanced accuracy.
Does the Three Black Crows pattern occur in all time frames?
Yes, the Three Black Crows pattern can occur in any time frame, like daily, weekly, monthly, or even intraday charts. However, patterns that appear on longer time frames (like daily or weekly charts) tend to be more reliable than the shorter time frame signals.
How do I trade the Three Black Crows pattern?
One should wait for additional confirmation, such as a break of a key support level or the appearance of further bearish technical signals, before creating a short position. Support levels or risk-to-reward ratios can be used to determine target levels. The stop-loss is usually placed above the high of the first candle in the pattern.
Disclaimer
The securities, funds, and strategies discussed in this blog are provided for informational purposes only. They do not represent endorsements or recommendations. Investors should conduct their own research and seek professional advice before making any investment decisions.