| Type | Description | Contributor | Date |
|---|---|---|---|
| Post created | Pocketful Team | Nov-19-24 |

- Blog
- trading
- candlestick patterns
- three inside up pattern
Three Inside Up Pattern

Have you ever tried to predict when a downtrend is about to reverse and if it’s a good time to enter a trade? The ‘Three Inside Up’ candlestick pattern is popular among traders for identifying bullish reversals. Whether you are a beginner learning the basics of technical analysis or an experienced trader, grasping the details of this pattern can help you make better trading decisions.
In this blog, we will explore the Three Inside Up pattern. We will analyze the meaning of each candle occurring in the pattern, how to set targets and stop-loss levels and discuss when this pattern is most effective as well as when it might produce false signals.
What is the Three Inside Up pattern?
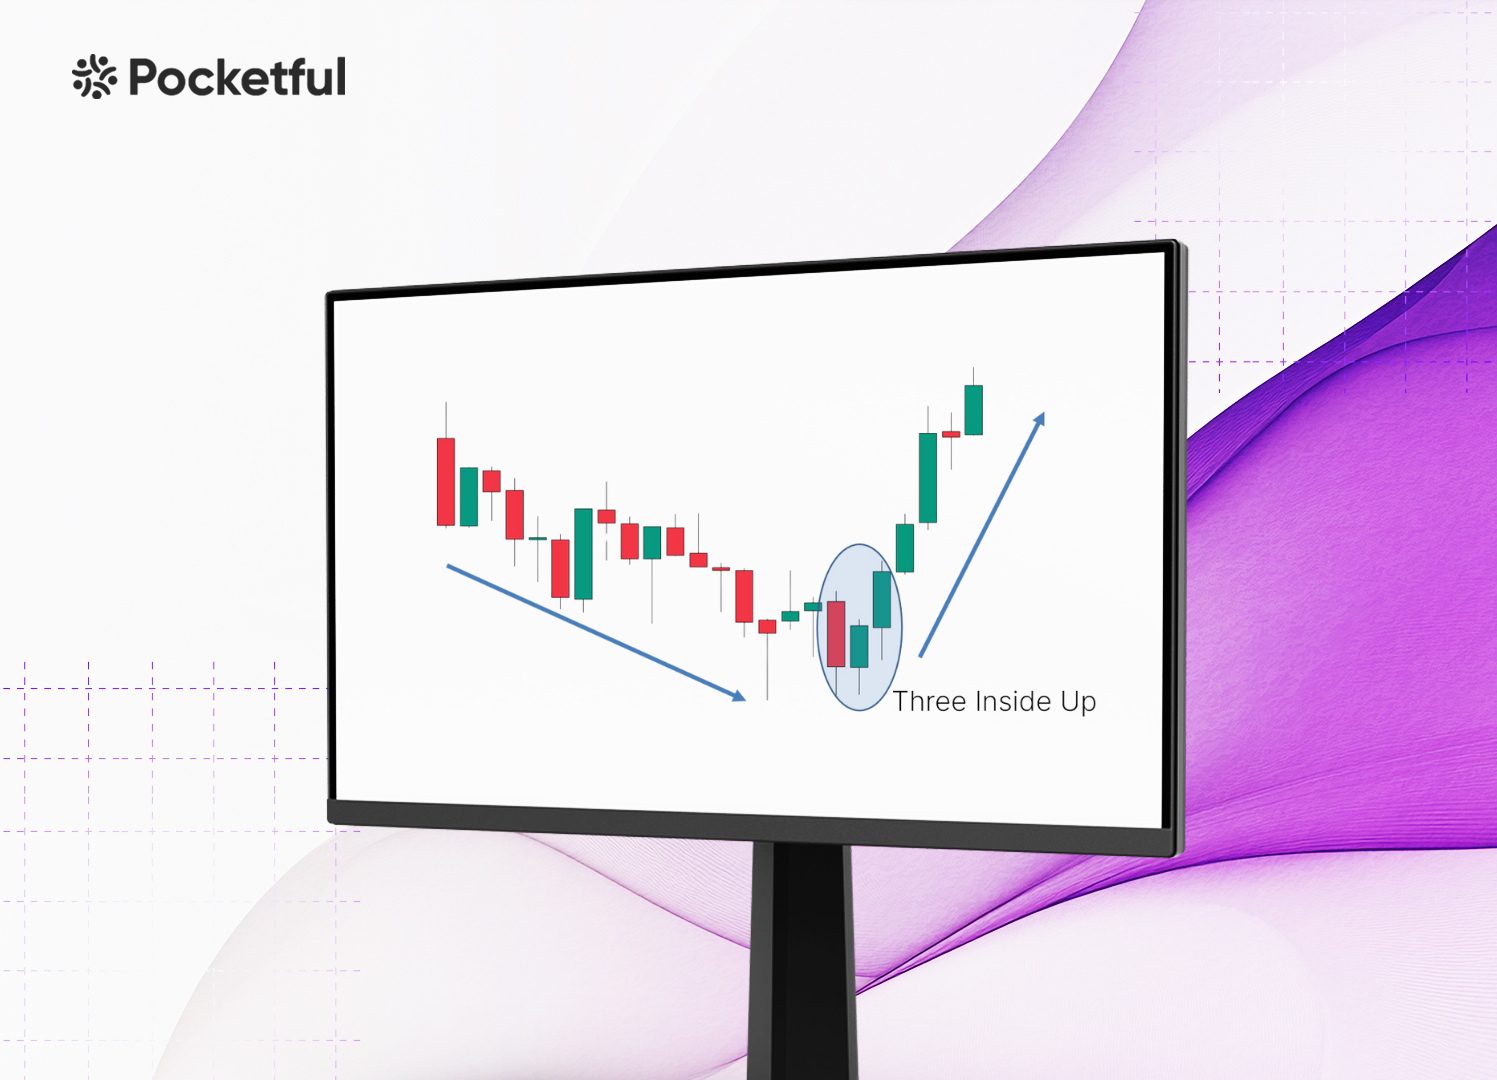
The three inside-up candlestick patterns indicate a bullish reversal, signaling a possible change from a downtrend to an uptrend. It involves a sequence of three specific candlesticks used by technical analysts to forecast upward market momentum.
The structure of Three Inside Up is as follows;
- First Candle – A long, red bearish candle that signifies an ongoing downtrend and strong selling pressure.
- Second Candle – A smaller green bullish candlestick that opens inside the first candle and closes higher than it opened, staying within the range of the first candle. This suggests a possible reversal as buyers begin to take control.
- Third Candle – A long green candle that closes above the first candle, indicating a momentum shift or a bullish reversal as buyers take complete control.
Traders often interpret the Three Inside Up pattern as a favorable signal to initiate a long (buy) position or to close an existing short position. The pattern is more reliable if it occurs after a downtrend and is confirmed by high trading volume. The larger the bodies of the first and third candles, the stronger is the reversal signal.
How to Determine Target and Stop-Loss?
Target and stop-loss are important for traders to trade effectively using this pattern. Below are a few ways to place targets and stop-loss orders while trading the Three Inside Up pattern.
Target
- Risk-Reward Ratio: A widely adopted strategy involves employing a fixed risk-reward ratio, such as 1:2 or 1:3. For instance, if your stop-loss is 10 points below the entry, a 1:2 risk-reward ratio means setting your target 20 points above the entry.
- Resistance Levels: Identify nearby resistance levels or recent highs as possible targets for taking profits. This is considered as a strategic point where the asset price faced resistance or failed to cross in the past.
Stop-Loss
- First Candle’s Low: A general placement for the stop-loss is just below the lowest point of the first candle in the Three Inside Up pattern. If the price falls below this level, it indicates that the reversal may not be successful.
- Second Candle’s Low: Furthermore, some traders also place it just below the low of the second green candle. This can lower risk but may raise the likelihood of triggering stop-loss in a volatile market.
Read Also: Three-Line Patterns
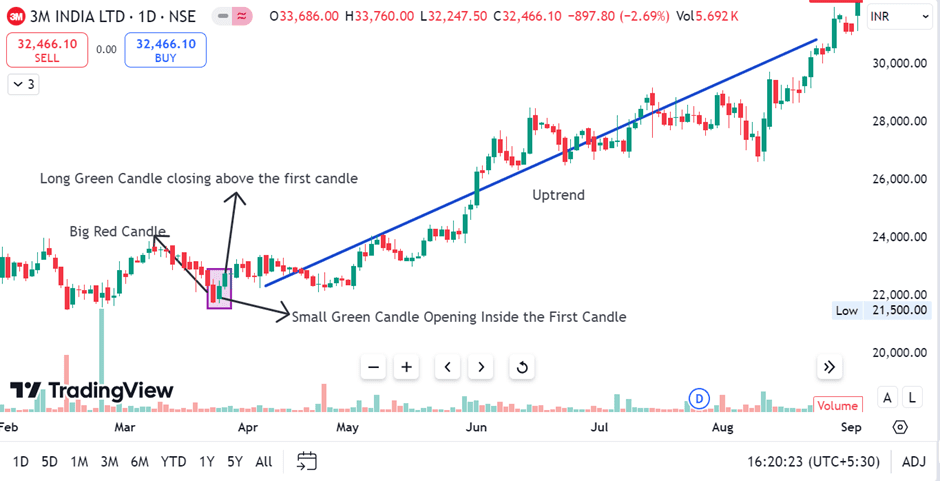
Example of Three Inside-Up Pattern of 3M India Ltd.

The chart above shows the clear formation of Three Inside Up on the daily chart of 3M India. The stock made a Three Inside Up pattern on 27 March 2023. The stock price increased from INR 22,752 and made a high of INR 23,250 on 29 March 2023. We can also notice a significant uptrend with some minor retracements in the following months.
Advantages of Three Inside Up Pattern
The advantages of using a Three Inside Up pattern are:
- Clear Reversal Sign: The pattern signals a possible bullish reversal in a downtrend, making it easier for traders to identify a change in the market sentiment.
- Easy to Recognize: The pattern features a combination of three candles with distinct characteristics, which helps traders to easily identify this pattern on a price chart without the need for deep analysis.
- Support for Momentum-Based Strategies: The third candle shows strong buying pressure, making the pattern effective for momentum trading, especially when backed by indicators like volume.
- Versatile across Multiple Time Frames: This pattern can be used on monthly, daily or hourly charts, making it suitable for several trading styles like swing and day trading.
Limitations of Three Inside Up Pattern
The limitations of using a Three Inside Up pattern are:
- Risk of False Signals in Consolidation: In choppy markets, the three inside-up pattern often give false signals. If there is not a clear downtrend beforehand, the pattern might not signal a true reversal, which could result in losses.
- Strong Downtrends: In a strong downtrend, the bullish signal might be weak because the downtrend momentum could overpower it. Reversal patterns tend to be more effective when the downtrend weakens, or the price approaches support levels.
- Not 100% Accurate: Like any other candlestick pattern, the Three Inside Up pattern is not always accurate. Market factors like news or economic conditions can override technical signals, causing unexpected price movements.
- Limited Profit: The pattern usually has targets near resistance levels or follows a fixed risk-reward ratio, which may cause traders to miss significant moves during a strong uptrend.
Read Also: Three Outside Up Pattern
Conclusion
In conclusion, the three inside-up pattern is a well-known pattern among traders looking to spot bullish reversals near the bottom of a downtrend. The structured three-candle formation suggests a possible transition from bearish to bullish sentiment, offering simple guidelines for entry points, stop-loss placements and targets. However, like all technical patterns, it has its limitations. In volatile markets, this pattern may give you false signals during a strong downtrend. Therefore, using this pattern alongside other technical indicators or market analysis is important to enhance accuracy. Traders can effectively use the three inside-up pattern by understanding its strengths and weaknesses, enhancing their ability to spot trend reversals while managing risk.
Frequently Asked Questions (FAQs)
What is the structure of the Three Inside Up pattern?
The pattern consists of three candles: a big red candle, a smaller green candle within it, and a third bullish candle that closes above the first.
What does the Three Inside Up pattern suggest to the traders?
It signals that selling pressure is weakening and buyers are gaining control, suggesting a possible trend reversal.
Is high volume important for this pattern?
Yes, the high volume during the formation of the third candle strengthens the pattern’s reliability as it shows strong buying interest.
How can I use the Three Inside Up pattern in trading?
Traders often use it as a buy signal after a downtrend and create long positions after the third candle closes above the first candle’s high.
What is the difference between the Three Inside-Up and Three Outside-Up pattern?
Three Outside Up is a similar bullish reversal pattern, but the second bullish candle completely engulfs the first bearish candle.
Disclaimer
The securities, funds, and strategies discussed in this blog are provided for informational purposes only. They do not represent endorsements or recommendations. Investors should conduct their own research and seek professional advice before making any investment decisions.