
| Type | Description | Contributor | Date |
|---|---|---|---|
| Post created | Pocketful Team | Oct-20-24 | |
| Add new links | Nisha | Mar-18-25 |
Read Next![]()
- MCX Trading: What is it? MCX Meaning, Features & More
- Top 10 Intraday Trading Strategies & Tips for Beginners
- How to Use Pivot Points in Intraday Trading?
- What is Intraday Trading?
- Understanding Intraday Trading Timings
- How to Choose Stocks for Intraday the Right Way?
- Blending Candlestick Patterns: How It Works, Benefits & Drawbacks
- Market Order Vs Limit Order: What’s the Difference?
- Silver Futures Trading – Meaning, Benefits and Risks
- What is Crude Oil Trading and How Does it Work?
- Top Algorithmic Trading Strategies of 2025
- What is Paper Gold? – Meaning, Types, & Benefits
- What is Algo Trading?
- What is Tick Trading? Meaning & How Does it Work?
- Rising Window Candlestick Pattern
- Black Candle Pattern
- Piercing Pattern
- High-Wave Candlestick Chart Pattern
- Closing Black Marubozu Candle
- What is the Best Time Frame for Swing Trading?

- Blog
- trading
- candlestick patterns
- tweezer bottom
Tweezer Bottom Pattern
|
|
The Tweezer Bottom is one of the best-known candlestick reversal patterns applied in technical analysis, suggesting a possible reversal from a downtrend. Typically, it marks the end of a bearish trend, signaling a shift in market mood – from a downtrend to an uptrend. This makes it an integral part of the trading strategy for traders who use price action and chart patterns to predict market movements.
This blog will discuss the Tweezer Bottom candlestick pattern, its main features, and its practical use in trading strategies. Understanding this pattern is essential to make better trading decisions.
Tweezer Bottom Pattern – An Overview
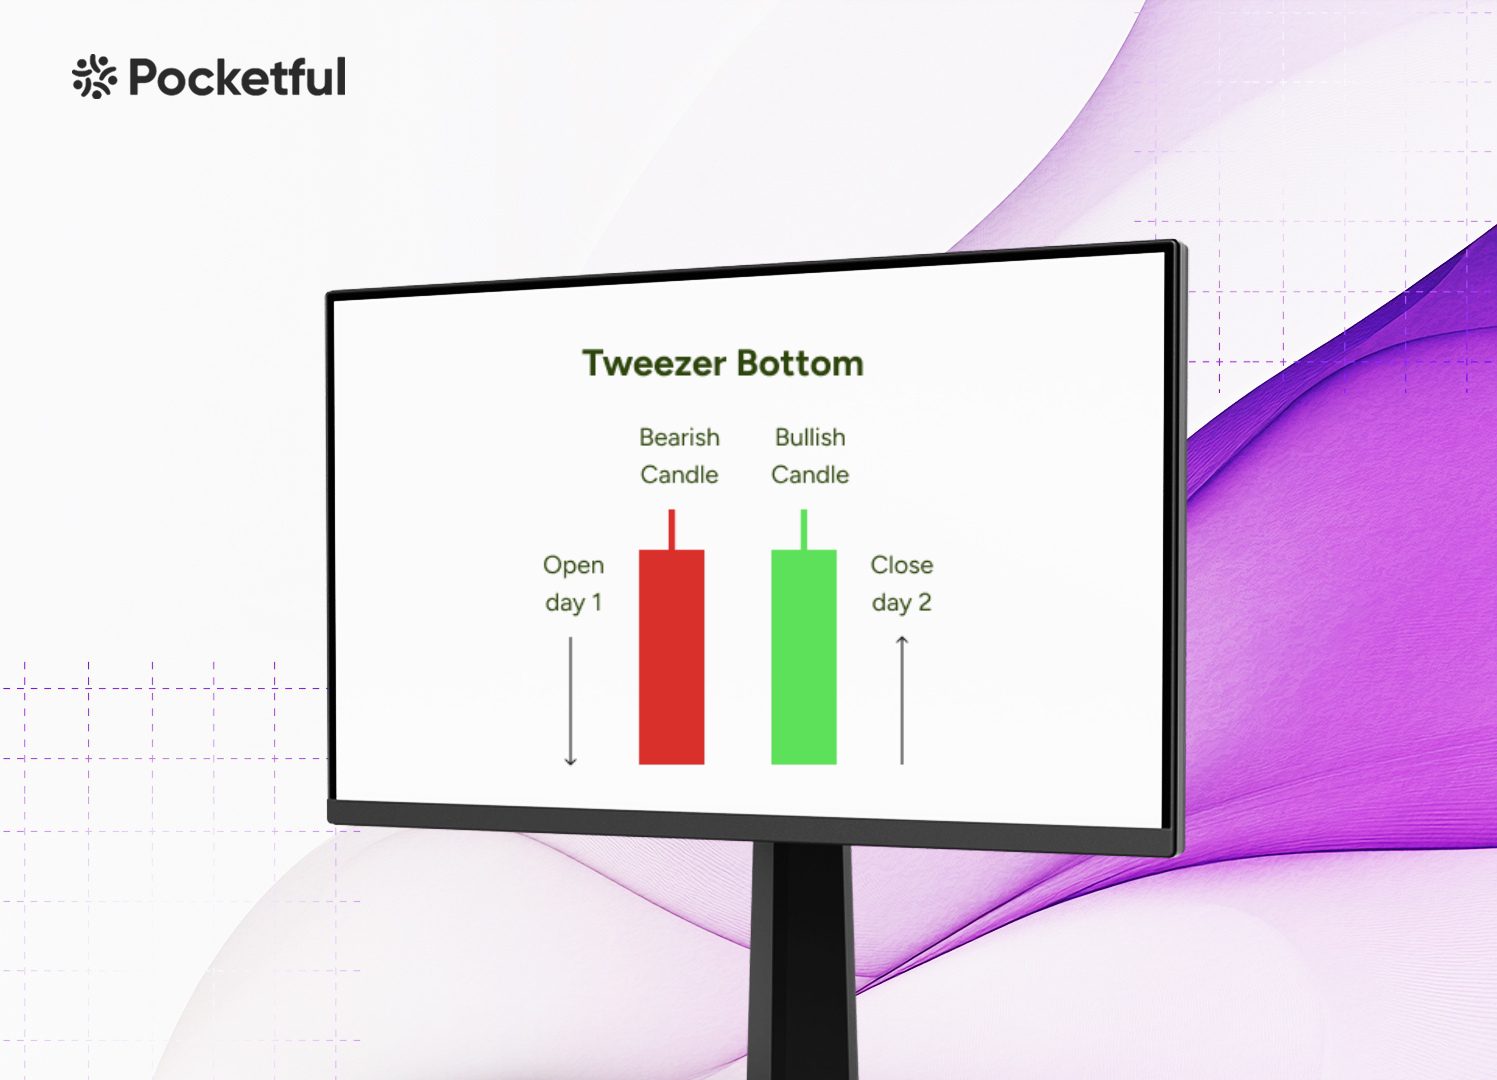
A Tweezer Bottom is a bullish reversal candlestick pattern that usually occurs at the end of a downtrend. It consists of two candlesticks, explained below:
- First Candle: The first candle is bearish, showing the sellers are in control of the market direction, which is evident by the already established downtrend.
- Second Candle: The second candle is bullish, indicating a shift in market sentiment from bearish to bullish.
The interesting feature of this pattern is that both the candles have approximately equal lows. This pattern indicates a possible bullish reversal, showing that buyers have surpassed selling pressure to drive prices up. A surge in trading volume while the second candle is being formed further enhances the credibility of the pattern.
Interpretation
Interpretation of the pattern is important to increase the chances of success in financial markets. Traders should confirm that the asset price shows a clear downtrend before the pattern forms. Also, the pattern is ineffective in consolidation or a range-bound market and works best in trending markets.
Identify the two candlesticks that share similar or identical low prices. The second bullish candlestick should close strongly, i.e. near its high. Moreover, a strong rejection of the lower prices by the second candle indicates a strong possibility of a reversal.
Traders should look for confirmation from other technical indicators and an increase in volumes. Once the pattern is validated, traders commonly initiate a long position once the asset price gives a breakout above the peak of the second candlestick.
Read Also: Tweezer Top Candlestick Pattern
How to Determine Target & Stop-Loss?
A trader can determine the target in the following ways:
- Resistance Levels: A highly effective approach to determining a target is to identify a key resistance level on the chart, which the asset price has struggled to cross in the past. After the breakout above the high of the second bullish candle, the price will likely advance toward the next level of resistance.
- Risk-Reward Ratio: It is important to establish a target that offers a good risk-reward ratio. A common risk-reward ratio is 1:2, meaning that for every INR 1 of risk, you are aiming for a profit of INR 2. This strategy assures profitability in the long run.
A stop-loss is important to protect against false breakouts and avoid huge losses. A stop-loss can be determined in the following ways:
- Low of the Pattern: Since both the candles have similar lows, a stop-loss is usually set just below the low of the two candles to exit the trade if the asset price moves below this support level.
- Support Levels: If you have a high-risk tolerance and don’t want your stop-loss order triggered due to small price fluctuations, consider placing a stop-loss below the next support level.
Effectively managing your stop-loss and target levels can help you minimize losses and maximize gains when trading the Tweezer Bottom pattern.
Example of Tweezer Bottom Pattern
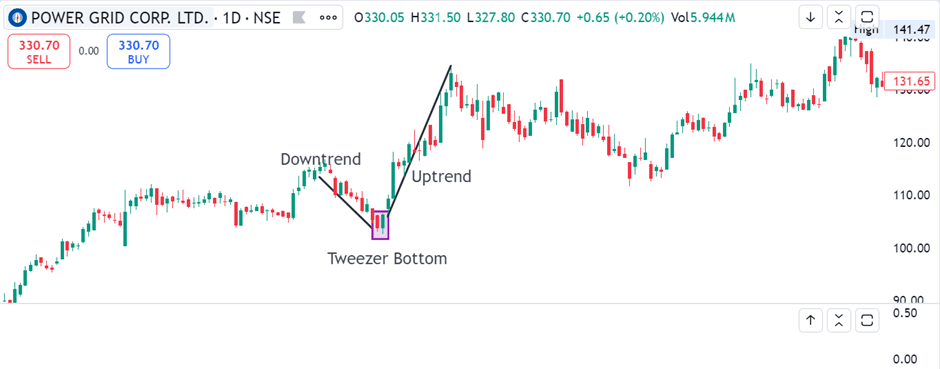
The above image shows the daily chart of Power Grid Corporation. A clear formation of the Tweezer Bottom candlestick pattern can be seen after a downtrend with almost similar low prices which is followed by an uptrend. The stock price was INR 106 on 1 February 2024 when the pattern was formed. The stock made a high of INR 133 on 18 February 2024.
Advantages of the Tweezer Bottom Pattern
Tweezer Bottom pattern acts as a powerful visual indicator of trend reversal in a downtrend. The advantages of a Tweezer Bottom pattern are:
- Easy to Recognize: The pattern is easy to recognize due to its simple structure, due to which even new traders can use it.
- Effective across Multiple Timeframes: This pattern can be used across various timeframes, effectively predicting bullish reversals in both short-term and long-term charts. This versatility enables traders with different trading styles to use this pattern easily.
- Strong Reversal Signal: Once validated by other technical indicators or price movement, the Tweezer Bottom pattern can effectively determine bullish reversals near the low of a downtrend.
Limitations of the Tweezer Bottom Pattern
While the Tweezer Bottom Pattern offers remarkable benefits, it is important to understand that it does not assure a reversal. Some of its limitations are:
- Dependent on other Technical Tools: The pattern depends on other technical tools for confirmation. It is recommended to use the Tweezer Bottom pattern with other technical indicators or price action signals for better reliability.
- Ineffective in Volatile Markets: The effectiveness of the pattern can be significantly impacted by the prevailing market conditions. In highly volatile markets, the pattern’s signal of bullish reversal may be less reliable.
Read Also: Chart Patterns All Traders Should Know
Conclusion
The Tweezer Bottom candlestick pattern helps traders spot potential reversals in a downtrend. Although it is easy to identify and use this pattern, its effectiveness significantly improves when combined with other technical analysis tools. Traders can enhance their accuracy in the market by recognizing this pattern, validating it with other indicators, and using effective risk management techniques. Practice and experience are essential for mastering the Tweezer Bottom pattern. However, it is essential to consult a financial advisor before trading.
Frequently Asked Questions (FAQs)
What does the Tweezer Bottom pattern indicate?
It suggests the weakening of the selling pressure, and buyers may be taking control, signaling a possible reversal in price direction.
Is volume important in interpreting a Tweezer Bottom pattern?
Yes, higher volume during the formation of the second bullish candle can confirm the strength of the bullish reversal.
Can a Tweezer Bottom appear in any timeframe?
Yes, the Tweezer Bottom pattern can be found across various timeframes, from minute charts to daily or weekly charts, but it is most reliable in higher time frames.
Is this pattern useful in a sideways market?
The Tweezer Bottom pattern is ineffective in the sideways market, as there are higher chances of false breakouts.
What is the difference between a Tweezer Bottom and a Tweezer Top?
A Tweezer bottom signals a reversal from a downtrend to an uptrend, while a Tweezer Top signals a reversal from an uptrend to a downtrend.
Disclaimer
The securities, funds, and strategies discussed in this blog are provided for informational purposes only. They do not represent endorsements or recommendations. Investors should conduct their own research and seek professional advice before making any investment decisions.