| Type | Description | Contributor | Date |
|---|---|---|---|
| Post created | Pocketful Team | Sep-26-24 |
Read Next![]()
- What is a Harami Candlestick Pattern?
- What is Average Traded Price in Stock Market
- What is MIS in Share Market?
- 7 Common Mistakes in Commodity Trading New Traders Must Avoid
- Brokerage Charges in India: Explained
- What is a BTST Trade?
- How to Do Algo Trading in India?
- What Is CMP in Stock Market?
- MTF Pledge vs Margin Pledge – Know the Differences
- Physical Settlement in Futures and Options
- List of Best Commodity ETFs in India
- Bullish Options Trading Strategies Explained for Beginners
- Best Brokers Offering Free Trading APIs in India
- Top Discount Brokers in India
- Best Charting Software for Trading in India
- Benefits of Intraday Trading
- What are Exchange Traded Derivatives?
- What is Margin Shortfall?
- What is Central Pivot Range (CPR) In Trading?
- Benefits of Algo Trading in India
Tweezer Top Candlestick Pattern
Written by : Pocketful Team
|Updated by : Pocketful Team
Published on : 26th September 2024
|Updated on : 24th January 2025
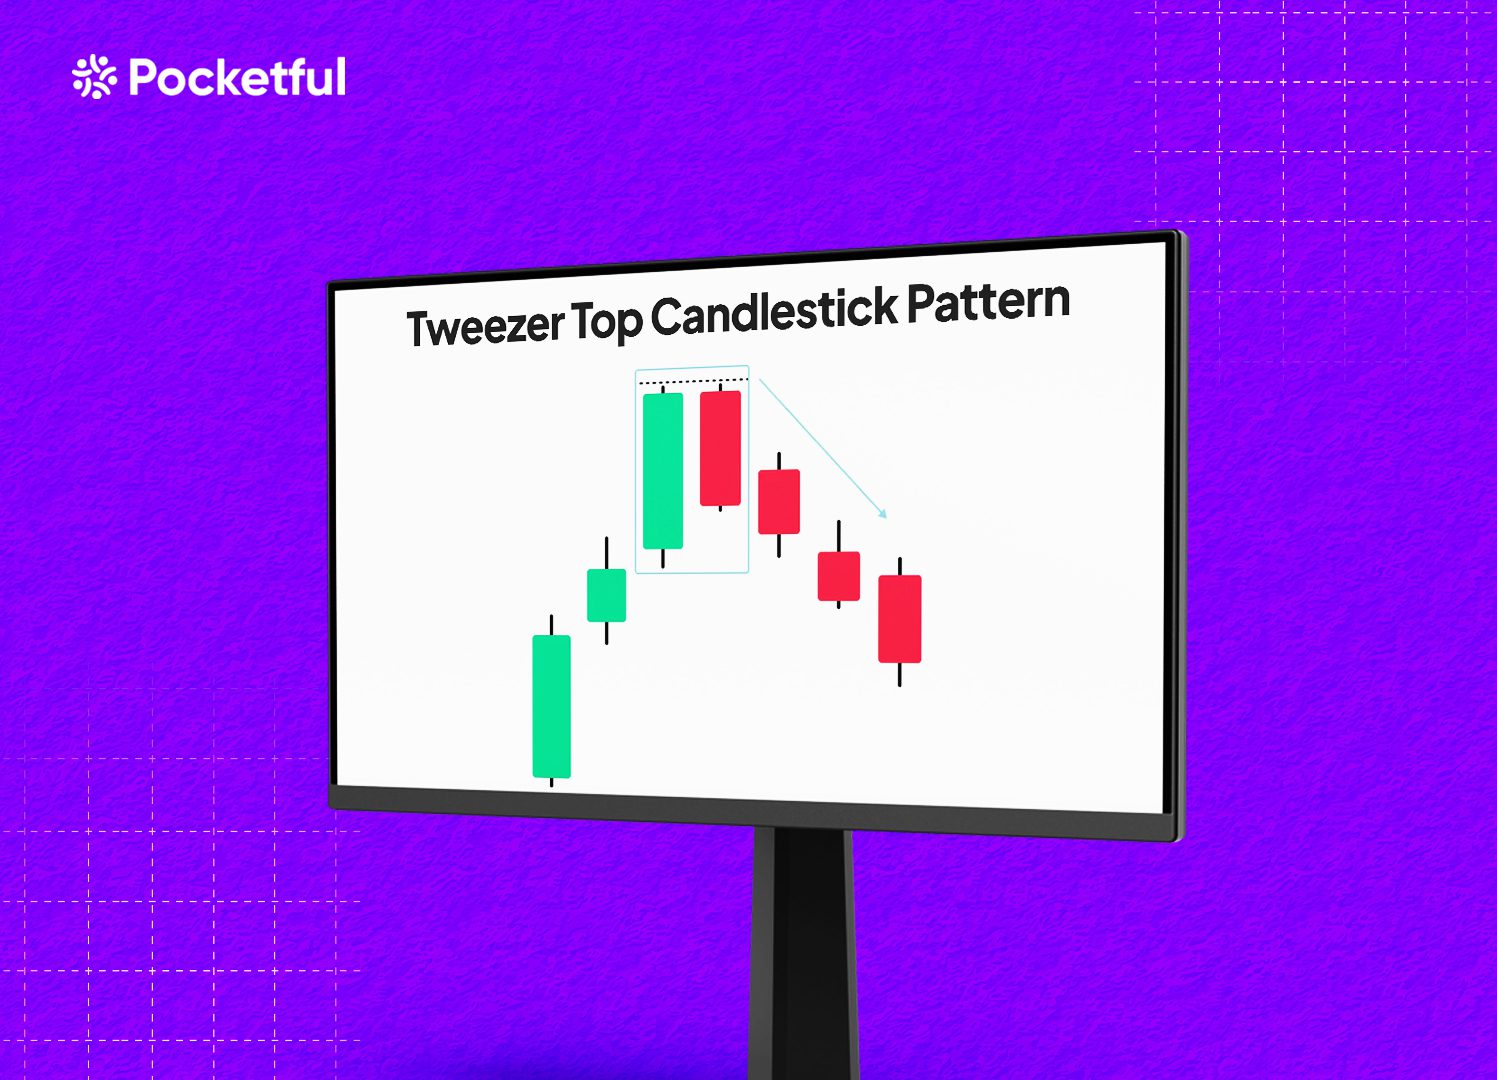
“Double the highs and half of the hopes” can be an apt way to describe the Tweezer Top candlestick pattern, as it indicates that the asset price is taking resistance and signaling a bearish reversal. Tweezer Top candlestick pattern is a bearish reversal pattern where two identical highs signal a fading uptrend, which suggests that the price of a security will reverse from bullish to bearish once the pattern is confirmed.
In this blog, we will discuss the Tweezer Top candlestick pattern, its characteristics, trading setup, advantages, and limitations with an example.
What is a Tweezer Top Chart Pattern?
Tweezer Top is a bearish reversal pattern that forms after a bull run in the asset price. It indicates a change of trend from bullish to bearish because it appears after an uptrend. The candlestick pattern consists of two or more candles with similar highs. The identical highs suggest that buyers have lost control and are unable to push the price higher. It is one of the key reversal patterns and can be observed in candlestick charts.
Characteristics of the Tweezer Top
The Tweezer Top pattern is a candlestick pattern used to identify a potential reversal from an uptrend to a downtrend. It unfolds in the following phases:
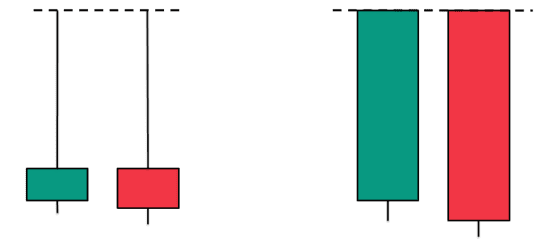
- At Least Two Candles: The Tweezer Top candlestick pattern consists of at least two candles with similar tops or a few candles with almost identical tops. The first candle is typically bullish, and the second candle is bearish.
- Formation: It generally forms after a long uptrend and indicates a possible trend reversal.
- Bearish reversal indication: The strength of the second candle decides the possibility of a trend reversal. The bearish candle can be in the form of Doji, Shooting Star, , etc.
- Psychology: The large bearish candle shows that the sellers are in control now, and the trend will reverse from bullish to bearish.
- Other Considerations: Always wait for confirmation in the form of further price decline after the formation of a bearish Tweezer Top candle. Once the next candle moves below the low of the bearish candle, check the volume for further confirmation. High trading volume confirms the change in trend, and an individual can create short positions or exit long positions.
This pattern helps traders recognize when a bullish trend may have come to an end, offering opportunities to exit long positions or to enter short positions.
Trading Setup
The Tweezer Top candlestick pattern can be effectively used by following the below trading setup:
- Entry Point: The entry point should be when the price breaks below the low point of the second candle. Traders can open a short position after taking confirmation, such as an increase in volume.
- Stop Loss: A stop loss should be placed ideally just above the high of the Tweezer Top pattern. The stop-loss will protect against losses if the price reverses or gives a false breakdown.
- Target: The target can be set at the next major support level, Fibonacci support levels, or can use risk and reward ratios such as 1:2 and 1:3, etc.
Advantages of Tweezer Top candlestick pattern
The advantages of the Tweezer Top candlestick pattern are:
- The pattern works well in any market, such as equity, currency, or commodity markets.
- It works in any time frame, but a bigger time frame means a strong trend reversal is expected.
- It’s one of the most popular candlestick patterns.
- It is easy to identify.
- The pattern is a reliable reversal signal indicator.
- The pattern provides a logical understanding of price action and a complete trading setup.
- The pattern can be combined with other indicators to get confirmation.
- The pattern offers an opportunity to create short positions or exit long positions in the market.
- This pattern gives quite accurate results if the breakdown occurs with strong volumes.
Limitations of Tweezer Top candlestick pattern
The limitations of the Tweezer Top candlestick pattern are:
- The pattern can give false signals in the sideways market.
- The pattern could give a false breakdown and fail like any other chart pattern, which can result in losses.
- This pattern could be affected by various market factors such as volatility, news, policy change, political instability, or other factors.
- The pattern’s reversal signal requires confirmation from other indicators for better accuracy.
Read Also: Introduction to Bullish Candlestick Patterns: Implications and Price Movement Prediction
Example: Tweezer Top Pattern of Hindalco Industries.
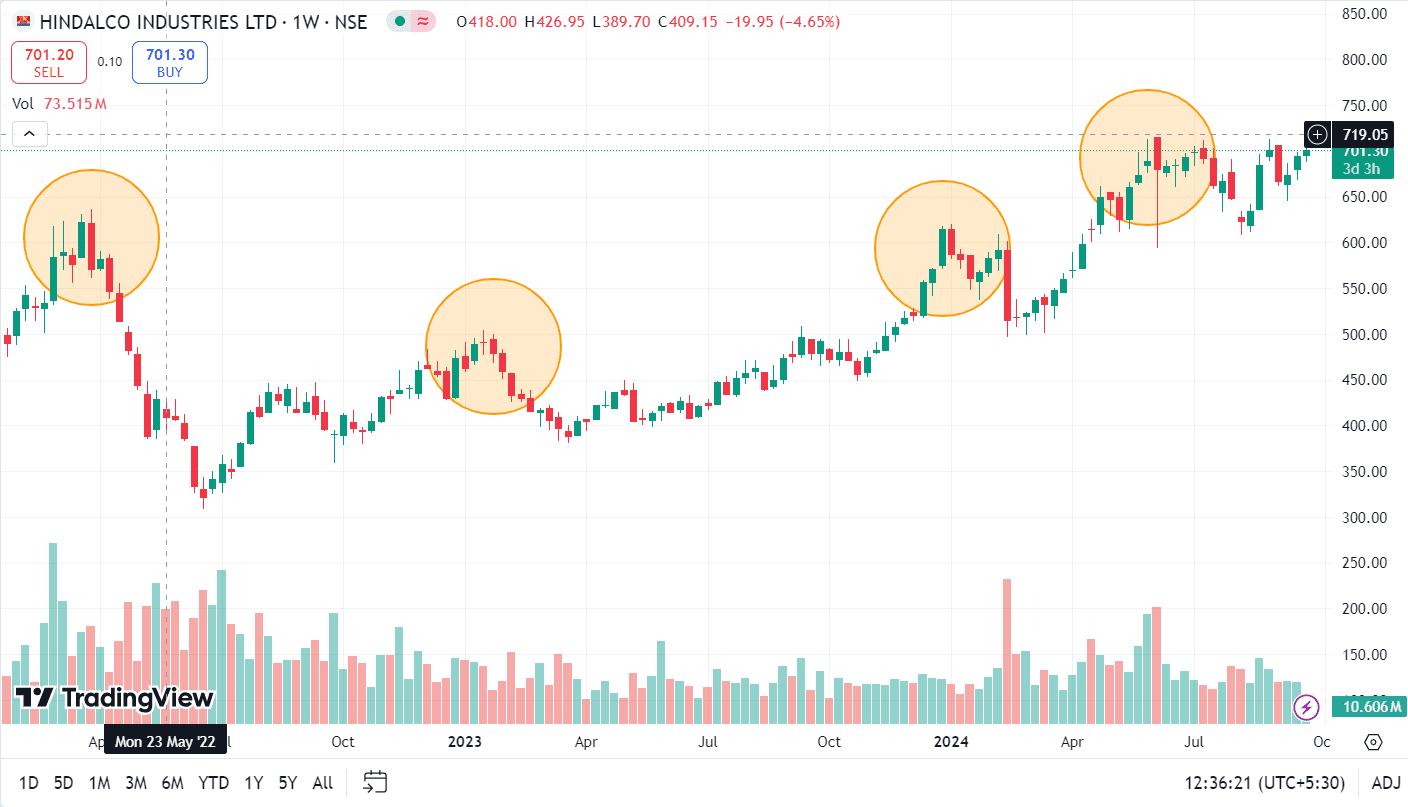
The above image shows the price chart of Hindalco Industries on a weekly time frame. The stock was in an uptrend between 2020 and 2022 and made a Tweezer Top pattern in March 2022, and the stock made two consecutive highs of INR 630 and INR 636. The second bearish candle completely engulfed the previous week’s high and low and also made a similar top, and then the stock price declined from a high of INR 636 to INR 309 in June 2022. It was a sharp downtrend as the stock declined approximately 50% from the top. The chart shows a sharp reversal from a continued two-year uptrend to a sharp downtrend and achieved the target. The stock made the same pattern in January 2023, December 2023, and recently, in June 2024, and the stock price has declined 15-25% after the pattern formation each time. The target zone can be marked using the Fibonacci Levels or the nearest major support levels. A stop-loss can be placed just above the engulfing candle’s top, and as the stock price declines, a trader can use a trailing stop-loss.
Read Also: Tweezer Bottom Pattern
Conclusion
The Tweezer Top candlestick pattern is a simple and powerful candlestick pattern for investors and traders alike. It generally involves two candlesticks, but in some cases, more than two candles can appear in the pattern with similar highs. The pattern signals a potential bearish reversal in the security price from bullish to bearish. Look for confirmation from other technical indicators and volume spikes to get a strong breakdown signal. It is popular because it is easy to identify, but it also has limitations, such as false signals in the sideways market, short-term time frames, etc. Hence, it is very important to understand the pattern’s characteristics, trade setup, risk management, and strategies before using this pattern. It is advised to consult a financial advisor before trading.
Frequently Asked Questions (FAQs)
01
Can other factors affect the reliability of the Tweezer Top pattern?
Yes, other external factors such as news, economic data releases, results, or any other major social, economic, or political events can disrupt the pattern and invalidate the expected reversal. One should always consider the broader market conditions when trading chart patterns.
02
Can the Tweezer Top be used with other Indicators?
Yes, it is recommended to use the Tweezer Top pattern in conjunction with other technical indicators like the Relative Strength Index (RSI), MACD, or Fibonacci retracement for enhanced accuracy.
03
Does the length of the candlesticks matter in a Tweezer Top pattern?
Yes, the length of the candlesticks does matter. A bullish candle followed by a long bearish candle often indicates a stronger reversal. However, the key requirement is that both candles should have almost the same high.
04
Does the Tweezer Top pattern occur in all time frames?
Yes, the Tweezer Top pattern can occur and is effective in any time frame, such as daily, weekly, monthly, or even intraday charts. However, patterns that appear on longer time frames (like daily or weekly charts) tend to be more reliable.
05
Can the Tweezer Top pattern form with more than two candles?
The classic Tweezer Top pattern consists of two candles, but it can sometimes consist of three or more candles. The main requirement is that all the candles must have nearly the same highs, indicating a strong resistance.
Disclaimer
The securities, funds, and strategies discussed in this blog are provided for informational purposes only. They do not represent endorsements or recommendations. Investors should conduct their own research and seek professional advice before making any investment decisions.
