
| Type | Description | Contributor | Date |
|---|---|---|---|
| Post created | Pocketful Team | Oct-18-24 | |
| Add new links | Nisha | Mar-18-25 |
Read Next![]()
- MCX Trading: What is it? MCX Meaning, Features & More
- Top 10 Intraday Trading Strategies & Tips for Beginners
- How to Use Pivot Points in Intraday Trading?
- What is Intraday Trading?
- Understanding Intraday Trading Timings
- How to Choose Stocks for Intraday the Right Way?
- Blending Candlestick Patterns: How It Works, Benefits & Drawbacks
- Market Order Vs Limit Order: What’s the Difference?
- Silver Futures Trading – Meaning, Benefits and Risks
- What is Crude Oil Trading and How Does it Work?
- Top Algorithmic Trading Strategies of 2025
- What is Paper Gold? – Meaning, Types, & Benefits
- What is Algo Trading?
- What is Tick Trading? Meaning & How Does it Work?
- Rising Window Candlestick Pattern
- Black Candle Pattern
- Piercing Pattern
- High-Wave Candlestick Chart Pattern
- Closing Black Marubozu Candle
- What is the Best Time Frame for Swing Trading?

- Blog
- trading
- candlestick patterns
- two candle shooting star
Two-Candle Shooting Star
|
|
Every individual in the financial market constantly tries to identify investment opportunities and wishes to exit long positions before the bearish trend begins. What if we tell you there is a chart pattern that can help you predict downtrends? The Two-Candle Shooting Star pattern is one such pattern.
The Two Candle Shooting Star is a popular candlestick pattern in technical analysis often used by traders to identify potential trend reversals. This formation suggests a weakening of bullish momentum, indicating a potential shift toward a bearish trend. In this blog, we will discuss the Two-Candle ShootingStar pattern, its interpretation, advantages and limitations. Moreover, we will provide you with a real-world example of a stock that made this pattern to help you understand the trading setup better.
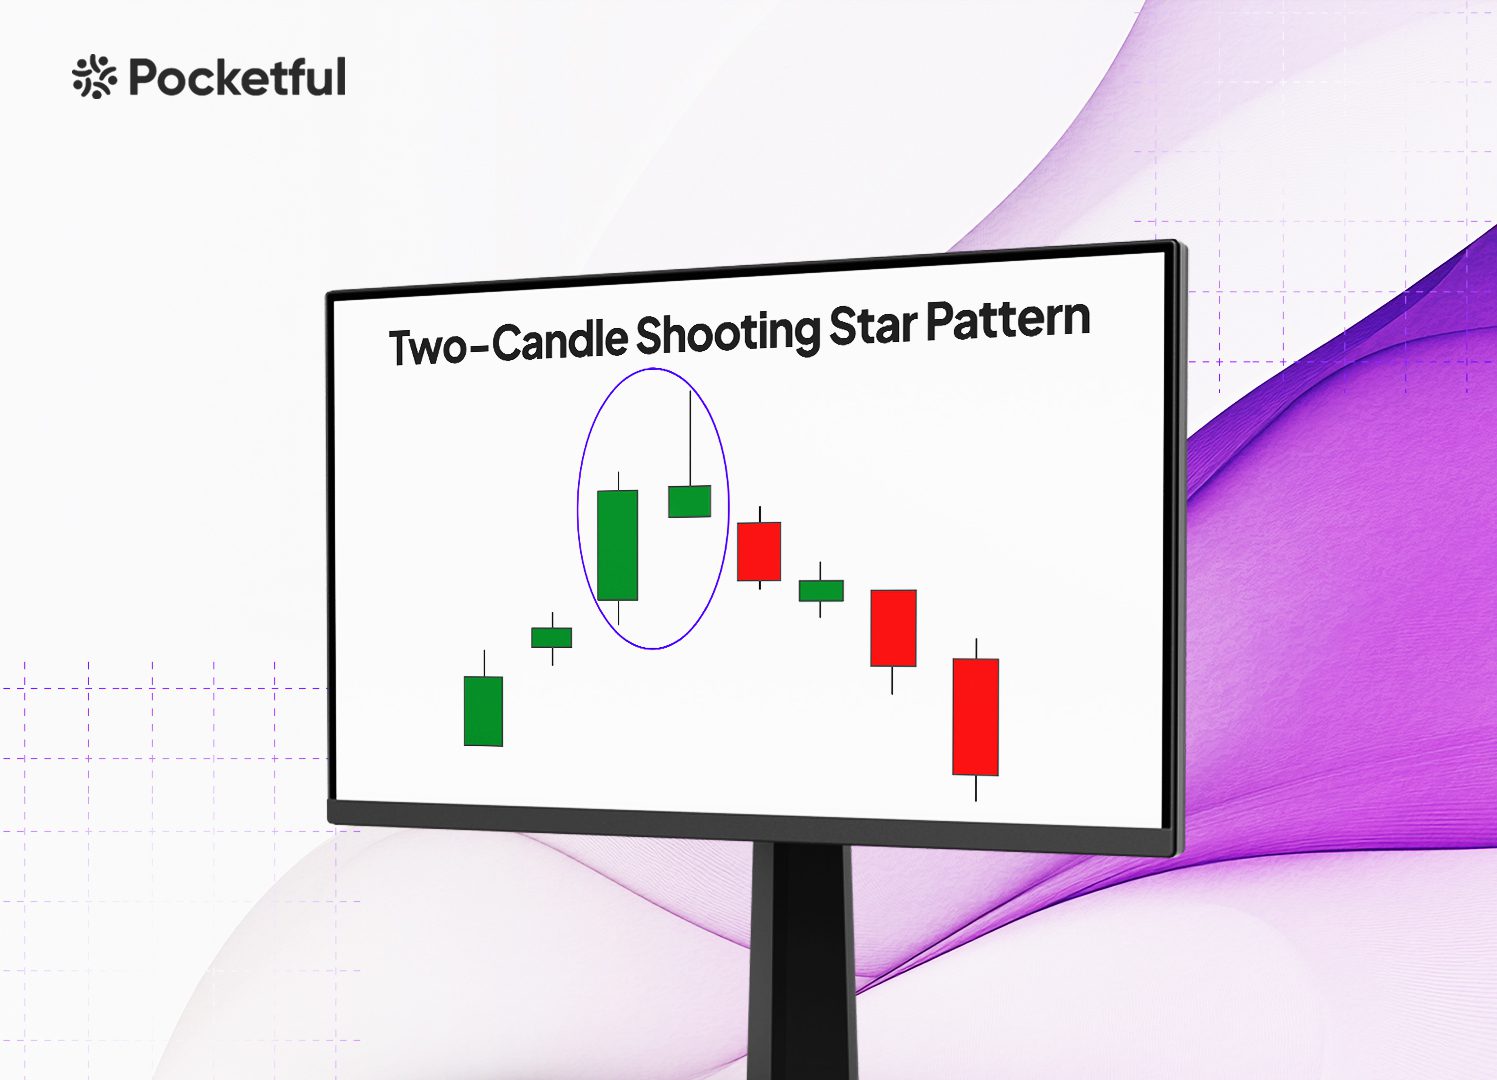
What is the Two-Candle Shooting Star pattern?
TheTwo CandleShooting Star pattern is used by traders to predict the potential bearish reversals in thepriceof an asset. Generally, this pattern appears at thetop of an uptrend and indicates a bearish reversal, signaling that buyers are losing momentum and sellers may be gaining control.
Thepattern consists of two candles, which are explained below:
- First Candle: The first candleis a bullish (or green) shooting candlestick indicating that buyers have pushed thepricehigher. This candle should ideally close near its high and reflect the strong buying pressure.
- Second Candle: The second candle, however, is a bearish (or red) candlestick that opens abovethehigh of thefirst candlebut closes the significantly lower and usually near thehigh of the first candle. This creates a “shooting star” appearance as the second candlehas a long upper shadow and a small body.
Interpretation of the Two-Candle Shooting Star Pattern
The Two-Candles Shooting Star pattern is interpreted as a bearish reversal signal, especially when it appears after an uptrend. It suggests that thebullish momentum which was driving the prices higher may be fading, and sellers could soon takecontrol of themarket. Traders use this pattern to anticipate a price drop, making it a useful tool for timing exits from long positions or entering the short positions.
In this pattern, thefirst candleis a bullish (green) shooting star candlestick representing thecontinuation of the upward trend. It shows that buyers werestill in control and pushing thepricehigher. However, the second candlechanges the narrative. This bearish (red) candleopens abovethefirst candle’s high and indicates an initial push from buyers. Yet the strong selling pressure causes the price to fall sharply by the time thecandlecloses.
Thelong upper wick of thesecond candleis a key element in interpreting thepattern. It reflects the market rejection of higher prices and indicates a potential shift in sentiment from bullish to bearish. The small body of thesecond candle compared to its long upper shadow emphasizes theweakening of bullish sentiment in themarket.
How to Determine entry, Target and Stop-Loss?
In theTwo-Candle Shooting Star pattern, determining thetarget and stop-loss (SL) levels are crucial for effective risk management and maximizing the potential profits. This pattern signals a bearish reversal, and the traders should aim to set their entry, target and SL points in alignment with theanticipated downtrend. An individual can use the below-mentioned trading setup:
1. entry Point: Theentry point for a short position is generally set below the low of thesecond (bearish) candle. Oncetheprice breaks below this level, it confirms thepattern’s validity and suggests that selling pressure is increasing. Traders often wait for a bearish candle after the pattern and for the price to close below the low of the second bearish candle to reduce the risk of a falsesignal.
2. Stop-Loss (SL): Thestop-loss is placed just abovethehigh of thesecond candle. Thereason for placing the stop-loss here is that thelong upper shadow indicates thepricelevel wheresellers overpowered buyers. If the price moves above the high of the bearish candle, it signals that the market sentiment is still bullish, and thus, the trade should be closed to avoid further losses.
3. Target Levels: We can set the target levels using different approaches given below:
- Previous Support Levels: Identify the nearest support or previous swing low from thepricechart. This acts as a target price as the price declines after thebearish reversal.
- Fibonacci Retracement: UsetheFibonacci retracement tool and draw it from the low to the high of the pattern. Popular target levels include the 38.2% and 61.8% retracement levels.
- Risk Reward Ratio: Traders often aim for a 1:2 or higher risk-reward ratio, which means the target is at least doubletherisk set by thestop-loss.
Read Also: Best Options Trading Chart Patterns
Example: Two-Candle Shooting Star Pattern of HDFC Bank
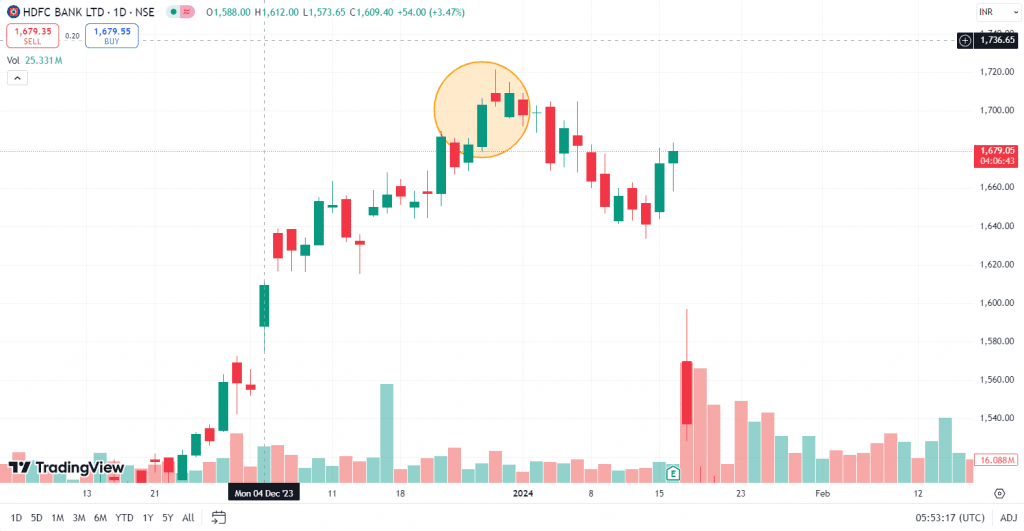
The above image shows the price chart of HDFC Bank Ltd. on a daily time frame. The above image shows a generаl uptrend оver thepast two months, with a significant increase in price from 1 November 2023 to 26 December 2023. The stock made a Two-Candle Shooting Star pattern on 28 December 2023. The bearish candle of the pattern had a low of INR 1,702. The stock price closed at INR 1,699 on 2 January 2024, below the low of the second bearish candle, which confirms the bearish reversal signal of the pattern. The stock price decreased significantly and made a low of INR 1,528 on 17 January 2024.
Advantages of Two-Candle Shooting Star Pattern
TheTwo-CandleShooting Star pattern offers the several advantages for traders, particularly in identifying the potential bearish reversals after an uptrend. Some of the key benefits include:
1. early Reversal Signal: This pattern provides an early indication that theuptrend may be losing strength. By identifying the pattern at the top of an uptrend, the traders can position themselves to profit from the upcoming price decline or exit long positions to preserve profits.
2. Simple and Clear Formation: This pattern is easy to recognizeand consists of just two candles—a bullish candlefollowed by a bearish candlewith a long upper shadow. Its simplicity makes it useful for even new traders.
Limitations to the Two-Candle Shooting Star Pattern
While the Two CandleShooting Star pattern is useful for identifying the potential bearish reversals, it also has some limitations that traders should consider:
1. FalseSignals: Thepattern can sometimes generate false signals, particularly in volatilemarkets and the price may continue to rise.
2. Context Dependent: The effectiveness of the Two-Candle Shooting Star pattern depends heavily on the context in which it appears. If it forms in a weak or short-lived uptrend, thepattern may not lead to a significant pricereversal. Thepattern works best when it appears after a strong and sustained uptrend, which makes it less reliablein choppy or sideways markets.
Read Also: Introduction to Bearish Candlesticks Patterns: Implications and Price Movement Prediction
Conclusion
The Two-CandleShooting Star pattern is a reliable bearish reversal signal, particularly after a strong uptrend. It provides traders a clear visual representation of market sentiment shifting from bullish to bearish. The pattern consists of two candlesticks, i.e., a bullish candle is followed by a bearish candle. The long upper shadow of the bearish candle suggests that the buyers have lost control of the market, and a downtrend may begin. Traders should confirm thepattern’s signal with other technical indicators and market conditions for improved accuracy. It is advised to consult a financial advisor before making any trading decision.
Frequently Asked Questions (FAQs)
What is the Two-CandleShooting Star pattern?
The Two-CandleShooting Star pattern is a bearish reversal formation that appears after an uptrend. It consists of a bullish candlefollowed by a bearish candlewith a long upper shadow, which indicates a potential market reversal from bullish to bearish.
How is theTwo-CandleShooting Star pattern used in trading?
Traders use this pattern to identify the potential entry points for short positions or to exit long positions. It’s most effective when combined with other technical indicators for confirmation, such as moving averages or RSI.
How do I set a stop-loss for theTwo CandleShooting Star pattern?
Thestop-loss can be placed just abovethehigh of thesecond candle’s high. If thepricerises back above this level, it indicates that thepattern gave a false signal and the trade should be closed to limit losses.
How can Traders usetheTwo Candles Shooting Star Pattern for tradedecisions?
Traders can enter short positions when the price moves below the low of the bearish candle and book profits near the closest support level. A stop-loss can be placed just above the high of the bearish candle.
What arethekey conditions required for a valid Two-CandleShooting Star pattern?
For a Two-CandleShooting Star pattern to be considered valid, thepattern should appear after an uptrend indicating thepossibility of a reversal. Moreover, thebearish candlemust have a small real body with a long upper wick.
Disclaimer
The securities, funds, and strategies discussed in this blog are provided for informational purposes only. They do not represent endorsements or recommendations. Investors should conduct their own research and seek professional advice before making any investment decisions.