| Type | Description | Contributor | Date |
|---|---|---|---|
| Post created | Pocketful Team | Oct-11-24 | |
| Unbold Content | Nisha | Mar-18-25 |
Read Next![]()
- What Is Leverage in the Stock Market?
- Common Trading Mistakes Beginners Make (And How to Avoid Them)
- How to Pledge ETFs for Margin in India
- What Is Expiry Day Trading?
- Best ETF Platforms for Trading and Investment in India 2026
- What Is Strike Price in Options Trading?
- What is Speculative Trading?
- What is Revenge Trading?
- What Is Time Decay in Options?
- What are Candlestick Patterns? 38 Candlestick Patterns Every Trader Must Know
- How to Read Stock Charts: A Beginner’s Guide to Chart Analysis
- What is Gold Trading?
- Top Algo Trading Programming Languages in 2026
- What is Short-Term Trading Vs Long-Term Trading Strategies?
- NSE Algo Trading Rules for Retail Traders in India
- What is a Harami Candlestick Pattern?
- What is Average Traded Price in Stock Market
- What is MIS in Share Market?
- 7 Common Mistakes in Commodity Trading New Traders Must Avoid
- Brokerage Charges in India: Explained
White Marubozu Pattern
Written by : Pocketful Team
|Updated by : Pocketful Team
Published on : 11th October 2024
|Updated on : 18th March 2025
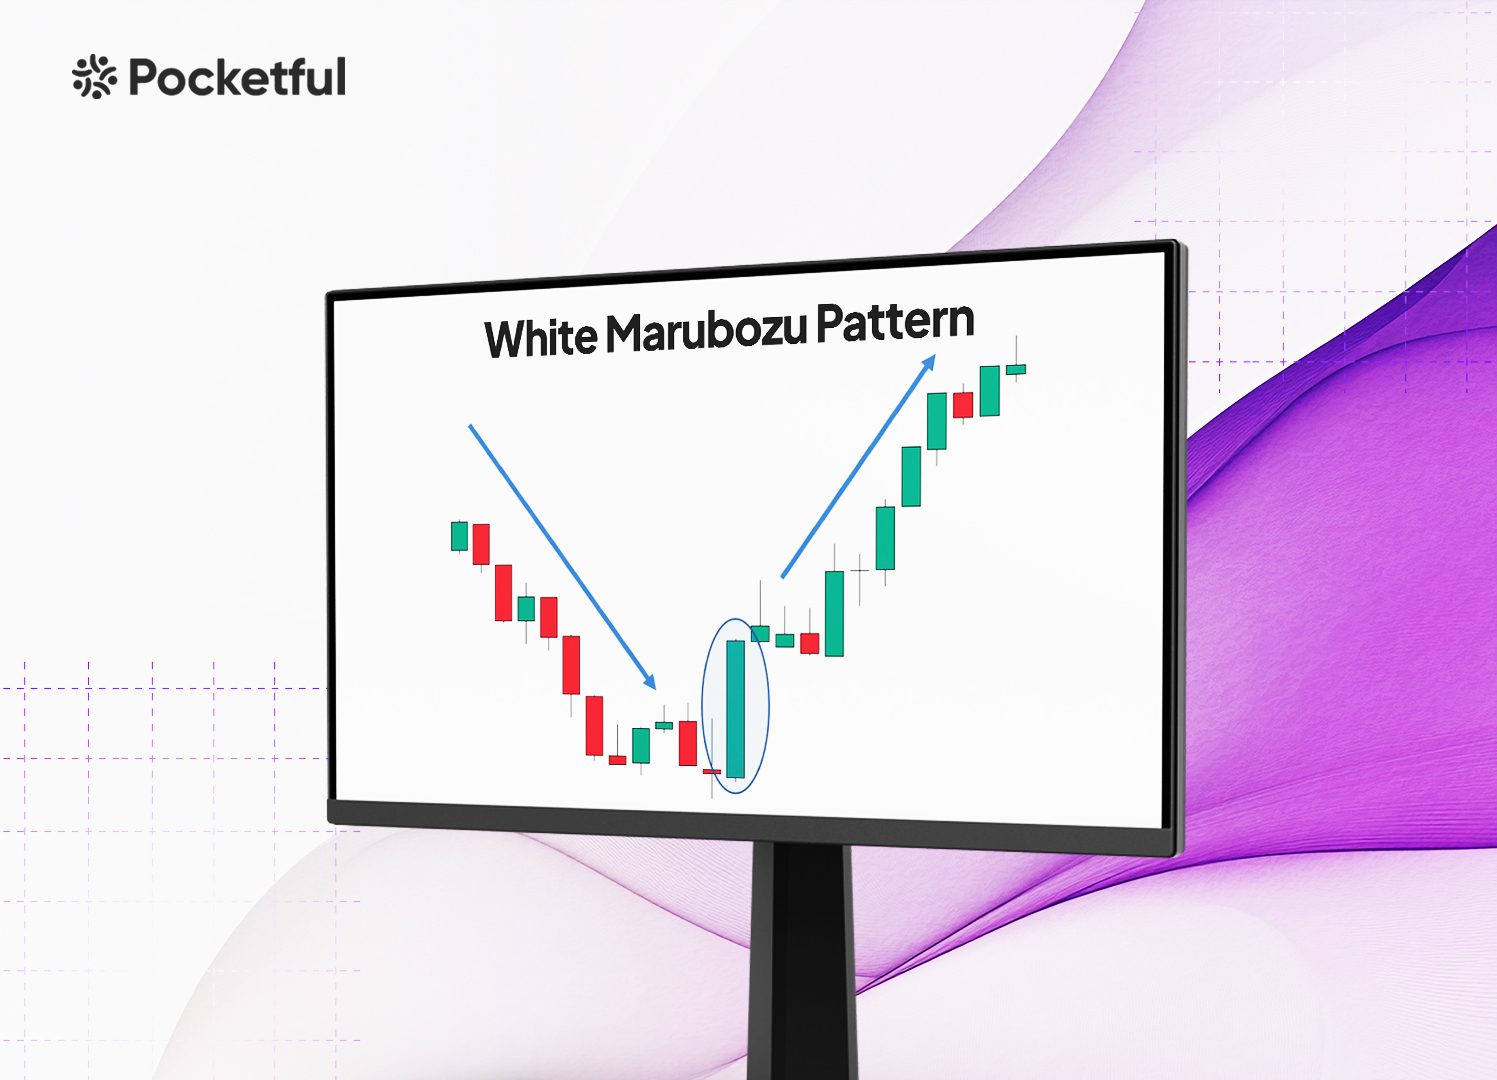
Do you want to know how to spot a bull run in the market or a particular stock before it happens? The White Marubozu candlestick pattern might just be the perfect solution. A WhiteMarubozu is a bullish candlestick pattern which is commonly observed in technical analysis of the stock charts. It has no shadows, indicating a strong buying pressure as the price steadily rises during the trading session.
In this blog, we will discuss the White Marubozu pattern, its interpretation, advantages and limitations. We will also discuss a real-world example to help you understand the trading setup better.
What is the White Marubozu pattern?
A White Marubozu is a powerful bullish candlestick pattern that signals the strong buying momentum in themarket. It is characterized by a long whiteor green candlestick with no upper or lower shadows, meaning the opening price is the lowest point of the session and theclosing priceis thehighest. This pattern occurs when buyers dominate the entire trading session and push prices higher consistently without any significant selling pressure.
The White Marubozu candlestick pattern indicates bullish market sentiment, and it is often interpreted as a sign of a potential continuation of a bullish trend or a reversal of a prior downtrend. When this WhiteMarubozu candleappears after a downtrend, it will suggest a bullish reversal, whereas, in an uptrend, it confirms the strength of the bullish momentum.
Interpretation of White Marubozu pattern
The WhiteMarubozu candlestick pattern can be used to get a reliable bullish signal in technical analysis. The pattern is easily identified due to its distinct appearance: a long, whiteor green candlestick with no shadows. This pattern forms when buyers dominates thetrading session, leaving no room for sellers to push thepricelower.
TheWhiteMarubozu candlestick pattern suggests that market sentiment is extremely bullish. It represents a strong surge in demand as the buyers control the ‘entire trading’ session. The absence of upper and lower wicks in theWhiteMarubozu candlestick implies that the price never dipped below the opening and is making new highs throughout the trading session, reinforcing thestrength of theuptrend.
When theWhiteMarubozu candleappears after a downtrend and it can indicatea potential reversal as the buyers are now stepping in to drive prices higher. In such cases, it is viewed as a bullish reversal pattern and suggests that the prior bearish trend is losing momentum, and a new uptrend might be around the corner.
How to determine Target and Stop-Loss?
Target and stop-loss (SL) are key components of a trading strategy. An individual can use the below-mentioned trading setup to effectively trade the White Marubozu pattern:
1. Target: Thetarget priceis usually based on the length of the White Marubozu candle. An individual can determine the target by measuring the length of the White Marubozu candle and projecting this length upwards from the closing price. The greater the length of the candle translates into greater target levels. Moreover, you can use the nearest resistance levels, Fibonacci levels, etc., to determine the target.
2. Stop-Loss (SL): The stop-loss for a WhiteMarubozu pattern should be placed slightly below the low of the candle. Setting thestop-loss a few points below the low of the candle helps protect against unexpected market reversals.
3. Risk-Reward Ratio: Traders often maintain a risk-reward ratio of 1:2 or 1:3 to remain consistently profitable. Traders generally combinetheWhite Marubozu pattern signal with other indicators (e.g. the support levels or moving averages) for better tradeconfirmation.
Read Also: Opening White Marubozu Pattern
Example of White Marubozu Pattern for Tata Motors
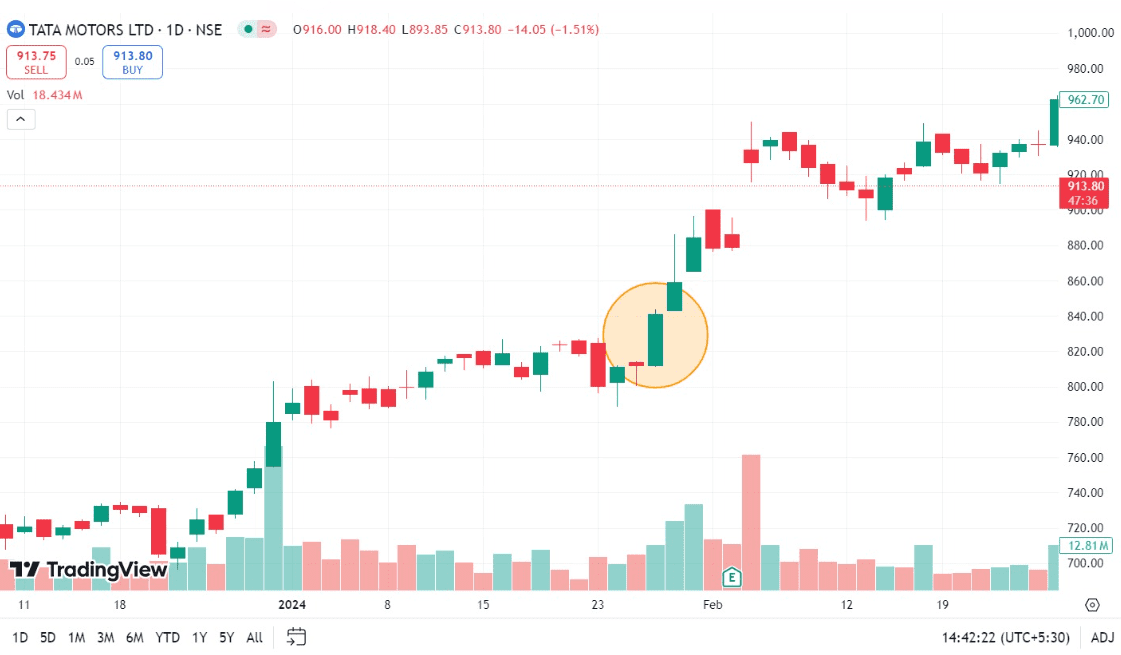
The above chart depicts the stock price performance of Tata Motors Ltd. on a daily time frame. Here, the stock was in an uptrend and on 29 January 2024, the stock made a White Marubozu candlestick pattern. The stock’s opening price and low of the candle were similar and approximately equal to INR 811, whereas the stock’s closing and high of the candle were approximately equal to INR 841. The length of the candle was around INR 29, which gives us a target price of INR 870 and a stop-loss level of INR 808. The target was achieved on the next trading day as the stock made a high of INR 885.
Advantages of the White Marubozu pattern
The WhiteMarubozu candlestick pattern offers several advantages for investors and traders using technical analysis to predict market trends.
1. Clear Bullish Momentum: One of themain advantages of thewhitemarubozu candlestick pattern is that it clearly indicates the strong bullish momentum. The absence of upper and lower shadows in theWhiteMarubozu pattern shows that buyers werein control throughout the session and pushed theprice from opening to closing without any significant selling pressure. This makes this pattern reliable in identifying the bullish market sentiment.
2. Trend Reversal Signal: The WhiteMarubozu candlestick is often used as an effective trend reversal signal, especially when it appears after a downtrend. It suggests that the bearish momentum is weakening and buyers are taking over, which makes it invaluable for traders looking to capitalize on potential trend reversals.
Disadvantages of the White Marubozu pattern
While the WhiteMarubozu candlestick pattern is widely used, it also has several disadvantages that traders should be aware of, some of which are listed below:
1. Lack of Context: Onekey disadvantageof theWhiteMarubozu candlestick pattern is that it doesn’t provide enough information about thebroader market context. While the WhiteMarubozu candle signals strong buying of the momentum, it doesn’t indicate how long this momentum will last.
2. FalseSignals: In a sideways market or consolidation, the White Marubozu may generate false signals. The appearance of a Marubozu candle might seem to indicate a potential bullish trend, but other factors, such as negative economic events, volatility, etc, can cause prices to reversequickly after the White Marubozu pattern forms.
Read Also: Closing White Marubozu Pattern
Conclusion
TheWhiteMarubozu candlestick pattern generates a strong bullish signal that reflects powerful buying momentum, making it valuablefor identifying the potential trend reversals or confirming the ongoing uptrends. Its simplicity and reliability allow traders to easily recognize the market sentiment and use it effectively while making trading decisions.
However, relying solely on theWhіteMarubozu pattern can lead to losses as it sometimes can generate falsesignals, especially in volatile or sideways markets. Overall, the WhiteMarubozu pattern is reliable, but an individual requires a more comprehensive approach to increase the accuracy of trading decisions.
Frequently Asked Questions (FAQs)
01
What is a WhiteMarubozu candlestick pattern?
TheWhiteMarubozu candlestick pattern is characterized by a long whiteor green candlewith no upper or lower shadows, reflecting strong buying pressure throughout the trading period.
02
What does a WhiteMarubozu candlesignify?
A WhiteMarubozu candlesignifies strong bullish sentiment and suggests that the buyers had complete control during the trading session. It works as a bullish reversal pattern at the bottom of a downtrend or a continuation pattern in an uptrend.
03
How is a WhiteMarubozu different from other candlestick patterns?
WhiteMarubozu candlestick lacks shadows, which represents uninterrupted buying pressure, while other candlestick patterns that haveupper or lower wicks.
04
How do traders usetheWhiteMarubozu pattern in their strategies?
Traders may use theWhiteMarubozu to create long positions or add to the existing ones in anticipation of further price increases.
05
Can theWhiteMarubozu pattern beused as a standaloneindicator for trading?
WhiteMarubozu generates a strong bullish signal, but relying only on a single pattern for trading decisions can lead to losses due to falsesignals. For example, in overbought conditions or near resistancelevels, a WhiteMarubozu might not indicate the sustained bullish momentum. It is important to use other technical indicators along with the White Marubozu pattern for better accuracy.
Disclaimer
The securities, funds, and strategies discussed in this blog are provided for informational purposes only. They do not represent endorsements or recommendations. Investors should conduct their own research and seek professional advice before making any investment decisions.
