| Type | Description | Contributor | Date |
|---|---|---|---|
| Post created | Pocketful Team | Sep-03-24 | |
| Add new links | Nisha | Mar-18-25 |
Read Next![]()
- What Is Leverage in the Stock Market?
- Common Trading Mistakes Beginners Make (And How to Avoid Them)
- How to Pledge ETFs for Margin in India
- What Is Expiry Day Trading?
- Best ETF Platforms for Trading and Investment in India 2026
- What Is Strike Price in Options Trading?
- What is Speculative Trading?
- What is Revenge Trading?
- What Is Time Decay in Options?
- What are Candlestick Patterns? 38 Candlestick Patterns Every Trader Must Know
- How to Read Stock Charts: A Beginner’s Guide to Chart Analysis
- What is Gold Trading?
- Top Algo Trading Programming Languages in 2026
- What is Short-Term Trading Vs Long-Term Trading Strategies?
- NSE Algo Trading Rules for Retail Traders in India
- What is a Harami Candlestick Pattern?
- What is Average Traded Price in Stock Market
- What is MIS in Share Market?
- 7 Common Mistakes in Commodity Trading New Traders Must Avoid
- Brokerage Charges in India: Explained
Ascending Channel Pattern
Written by : Pocketful Team
|Updated by : Pocketful Team
Published on : 3rd September 2024
|Updated on : 18th March 2025
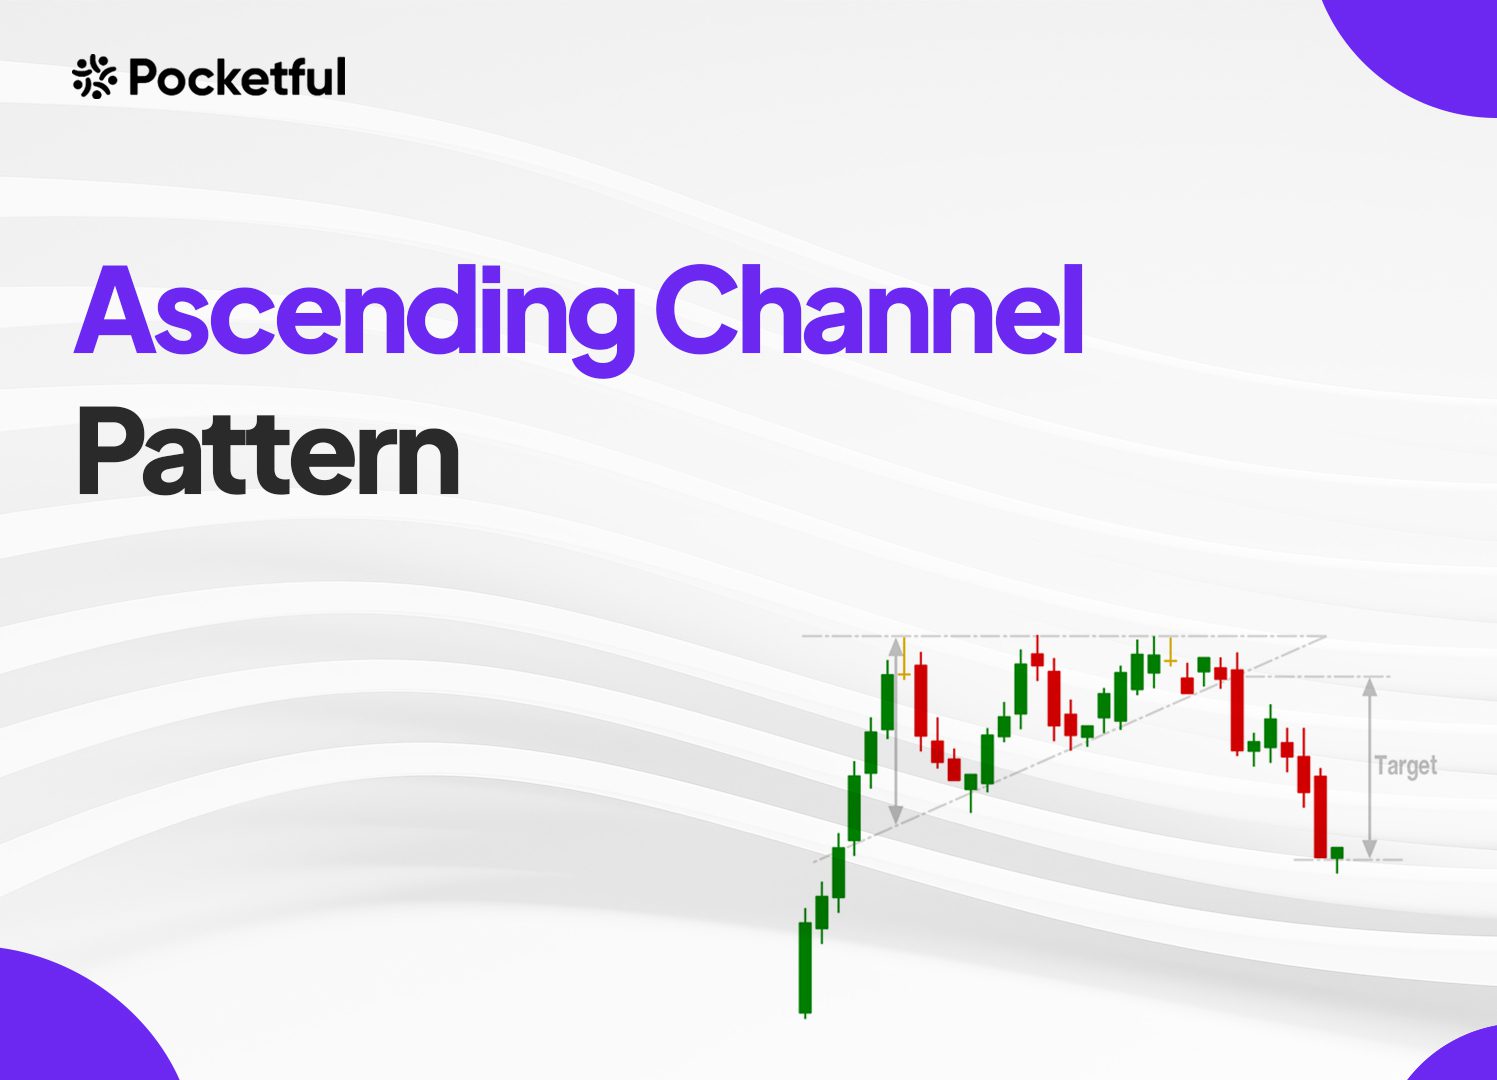
Ever wondered how traders manage to find precise buying and selling points in an uptrending market? The answer usually refers to recognizing patterns, such as the ascending channel. This powerful chart pattern portrays an ongoing uptrend by displaying a series of higher highs and higher lows, making it one of the favorite chart patterns of traders who want to surf the wave of market momentum.
In this blog, we will discuss how mastering the ascending channel sharpens your trading edge.
What is the Ascending Channel Pattern?
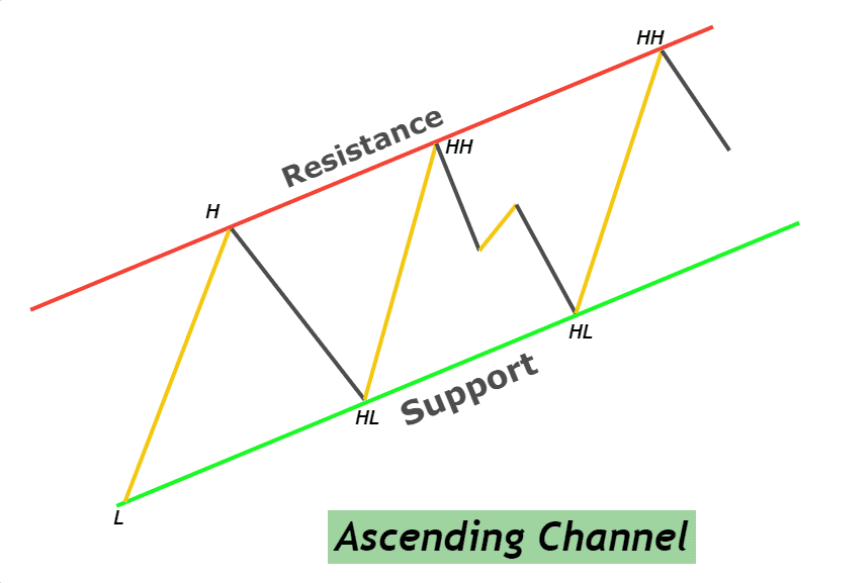
The ascending channel pattern is a bullish chart pattern in which two parallel upward-sloping trend lines contain all the price fluctuations. One trend line connects the higher highs, while the other trend line connects the higher lows, reflecting a consistent uptrend. This pattern signals that the buyers are in control, driving prices steadily higher while establishing predictable support and resistance areas.
It is also used by traders for the ascending channel to determine buying points near the lower trend line and selling points near the upper trend line. A breakout above the upper trendline indicates an accelerated trend continuation. A breakdown below the lower trend line indicates a potential trend reversal. Hence, it is very crucial to pay close attention to other confirmation signals.
Interpretation of Ascending Channel Pattern
The ascending channel pattern is generally viewed as a solid and steady uptrend, showing the market’s bullish sentiment. Herein lies the interpretation:
- Trend Continuation: The pattern often indicates a continuation of the prevailing bullish trend. If the price remains in the channel, this reflects sustained upward buying pressure, wherein traders can expect bullish movement.
- Support and Resistance Zones: The lower trendline then acts like a support level where buying pressure tends to increase, while the upper trendline serves as a resistance level where selling pressure builds. This creates predictable zones for making long and short positions.
- Possible Breakouts: A breakout above the higher trend line would indicate a probable acceleration in the uptrend and can be a buying opportunity. In contrast, a breakdown below the lower trend line could hint at the reversal of the trend, thus signaling to traders that they should create short positions.
- Indicator of Market Sentiment: The upward slope of the channel indicates positive market sentiment. The slope of the channel defines how aggressive the buying interest is, thus informing the traders about the trend’s sustainability.
Read Also: Ascending Triangle Chart Pattern
How To Trade Using Ascending Channel Pattern?
An individual can use the following steps to trade using an Ascending Channel Pattern:
Step 1. Identification of Ascending Channel:
- An ascending channel is created by drawing two parallel trend lines connecting higher highs, acting as a resistance, and higher lows, acting as a support.
- At least three points must be connected by upper and lower trendlines to confirm the channel.
- The price fluctuates between these two trend lines, forming an upward channel.
Step 2. Confirm the Trend:
- Generally speaking, this pattern will occur under an uptrend.
- Indicators like moving averages help further confirm the uptrend. The price will be above a 50-day and 200-day moving average.
Step 3. Entry Points:
- Buy at Support: Create a long position whenever the price touches the lower trendline (support line). Confirm its rebound with the hammer or engulfing candlestick pattern.
- Sell at Resistance: Create a short position whenever the price touches the upper trendline (resistance line). Confirm its rebound with the inverted hammer or engulfing candlestick pattern.
- Wait for Breakout Confirmation: A breakout above the upper trendline (resistance line) could confirm a continued uptrend. A breakdown below the lower trendline (support line) could confirm a bearish trend. If the breakout or breakdown occurs with high volumes, it will increase the chances of a bullish or bearish trend.
Step 4. Set Stop-Loss:
- Below Resistance Line: Place a stop-loss slightly below the upper trendline – the resistance line – to protect against a false breakout. In case of a false breakdown, place the stop-loss slightly above the lower trend line to avoid losses.
- Below Recent Swing Low: Alternatively, place the stop-loss below the most recent swing low outside the channel.
Step 5. Define Take-Profit Levels:
- Near Trend Line: Take partial profit near the trend lines and wait for a breakout or breakdown with reduced quantity.
- Based on Breakout: If it’s a breakout trade, project the target price based on either channel height or use Fibonacci extensions to estimate probable take-profit levels.
Step 6. Continuation or Reversal Signals through the Channel:
- Monitor changes in volume, price action, or technical indicators such as RSI or MACD. These can be used to identify a weakening trend or an upcoming reversal.
- The breakdown below the lower trendline could be a potential indication to start considering short positions.
Step 7. Adjust Stop-Loss and Take-Profit Orders:
- Move your stop-loss to lock in profits as the price moves in your favor. This could be done by moving the stop-loss to your breakeven point.
- Continuously monitor the trade and book profit after analyzing market conditions and channel development.
Key takeaways
- Volume confirmation: Always look for entry and breakout confirmation using volume data. Greater volume at breakout points decreases the possibility of a false breakout or breakdown.
- Risk Management: Traders must trade based on a good risk-reward ratio.
- Avoid overtrading: Do not chase trades when the price moves away from the lower trendline. Only enter if prices are near the trend lines or wait for a breakout or breakdown.
Read Also: Descending Channel Pattern
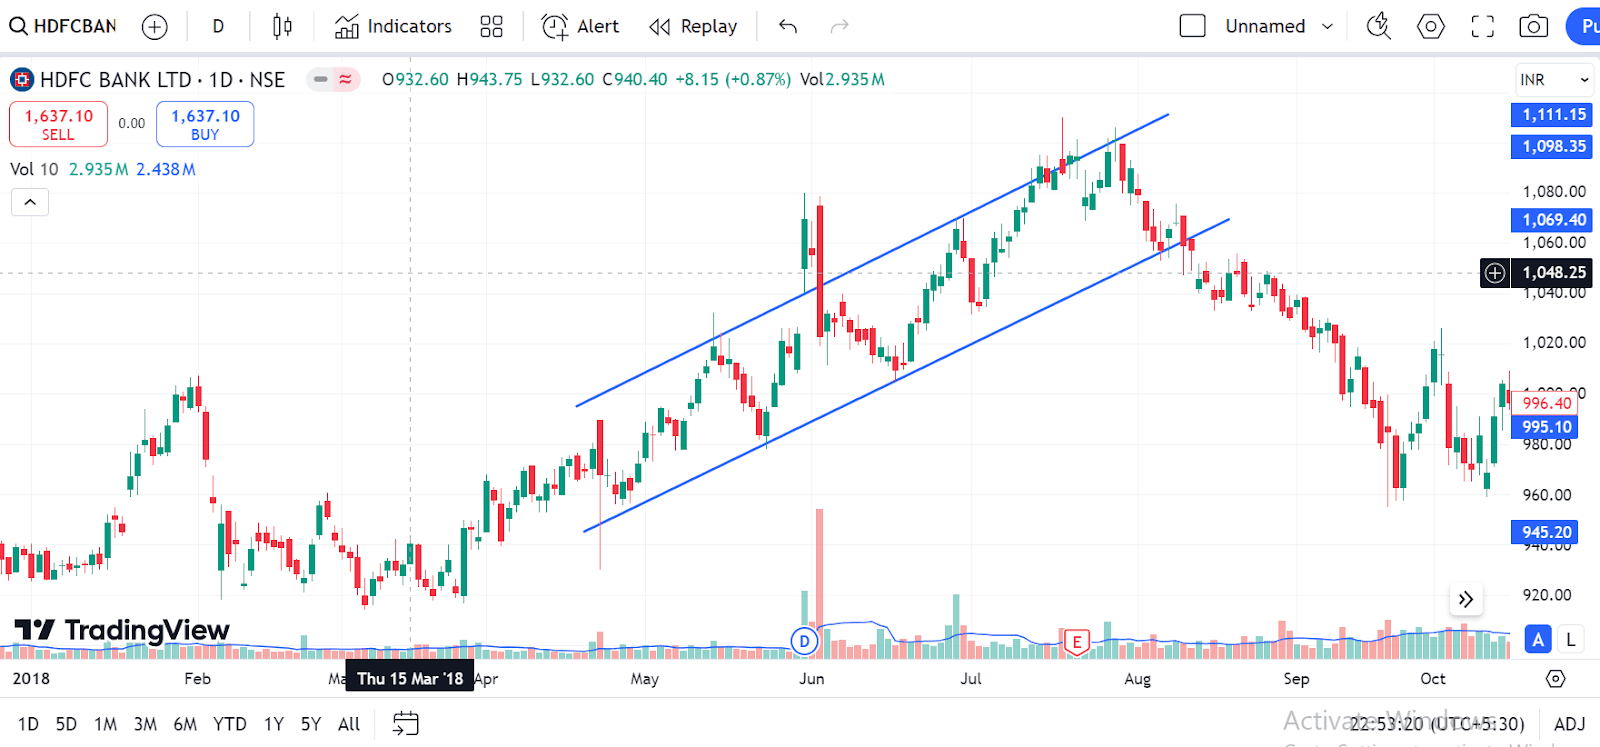
Example of Ascending Channel Pattern
Below is the chart of HDFC Bank Ltd. for a one-day time frame. The chart below shows the upper and lower trend lines in the ascending channel pattern, which can also be viewed as resistance and support lines. Likewise, the higher and lower low points touching this resistance and support can also be considered resistance and support points, respectively.
Advantages of Ascending Channel Pattern
The advantages of the Ascending Channel pattern are:
- Definitive Identification of Trend: The ascending channel pattern indicates an ongoing uptrend. It is easy to recognize, and an individual can easily use it.
- Predictable Entry and Exit Points: Another key feature of this pattern is its predictable entry and exit points. One can buy near the lower trendline, acting as support, and sell near the upper trendline, acting as resistance. Thus, the profit will be maximized while minimizing risk.
- Timeframe Diversity: It can be applied to numerous timeframes, making the ascending channel helpful for short-term and long-term traders. Whether you are day trading or swing trading, this pattern can be used.
Limitations of Ascending Channel Pattern
The limitations of the Ascending Channel pattern are:
- Risks of false breakout: The pattern is susceptible to false breakouts when the price breaks the upper or lower trendline and then reverses. This can result in early trade entries and stop-loss order execution, causing possible losses.
- Inability to determine when the pattern will terminate: It is difficult to determine when an Ascending Channel will end. Sometimes, the price breaks out or breaks down unexpectedly and surprises traders, resulting in a missed opportunity to trade or can result in potential losses.
- Over-reliance can be hazardous: One should not overly depend on an ascending channel pattern and neglect other indicators or market conditions. The accuracy of the pattern decreases in volatile market conditions.
Read Also: Rising Wedge Chart Pattern
Conclusion
The Ascending Channel pattern is an exceptional technique traders utilize to identify bullish trends and take long and short positions. Once identified, the trader can see a pattern of higher highs and higher lows, forming inside parallel trendlines. This pattern provides a roadmap for the trader to buy near support, sell near resistance, or wait for breakouts. Risk management techniques, such as stop-loss and take-profit orders, can be used to manage risks. However, it is advised to consult a financial advisor before investing.
Frequently Asked Questions (FAQs)
01
What is a false breakout in an Ascending Channel Pattern?
A false breakout occurs when the asset price briefly exits the channel and then abruptly enters the channel again.
02
How can traders use the Ascending Channel Pattern to identify target levels?
It enables traders to set target levels near the trendlines if the asset price fluctuates inside the channel. If the price moves outside the channel, the target price can be calculated using the channel width or other technical indicators.
03
What risks are involved in trading with an Ascending Channel Pattern?
The risks are false breakouts and sudden reversals that might catch the trader off guard, especially when traded without using other indicators.
04
How is volume important in the Ascending Channel Pattern?
Volume can be used for confirmation, as higher volumes during breakouts or breakdowns can decrease the probability of a false signal.
05
Can an Ascending Channel Pattern reverse into a downtrend?
A downtrend can occur after an Ascending Channel pattern if the price breaks below the lower trendline with strong volume.
Disclaimer
The securities, funds, and strategies discussed in this blog are provided for informational purposes only. They do not represent endorsements or recommendations. Investors should conduct their own research and seek professional advice before making any investment decisions.
