
| Type | Description | Contributor | Date |
|---|---|---|---|
| Post created | Pocketful Team | Aug-27-24 | |
| Add new links | Nisha | Mar-18-25 |
Read Next![]()
- MCX Trading: What is it? MCX Meaning, Features & More
- Top 10 Intraday Trading Strategies & Tips for Beginners
- How to Use Pivot Points in Intraday Trading?
- What is Intraday Trading?
- Understanding Intraday Trading Timings
- How to Choose Stocks for Intraday the Right Way?
- Blending Candlestick Patterns: How It Works, Benefits & Drawbacks
- Market Order Vs Limit Order: What’s the Difference?
- Silver Futures Trading – Meaning, Benefits and Risks
- What is Crude Oil Trading and How Does it Work?
- Top Algorithmic Trading Strategies of 2025
- What is Paper Gold? – Meaning, Types, & Benefits
- What is Algo Trading?
- What is Tick Trading? Meaning & How Does it Work?
- Rising Window Candlestick Pattern
- Black Candle Pattern
- Piercing Pattern
- High-Wave Candlestick Chart Pattern
- Closing Black Marubozu Candle
- What is the Best Time Frame for Swing Trading?

- Blog
- trading
- chart patterns
- ascending triangle continuation
Ascending Triangle Chart Pattern
|
|
Chart patterns are important for traders using technical analysis to predict market movements and make decisions. Among various chart patterns, the ascending triangle is a reliable chart pattern for identifying possible bullish breakouts. Whether you are an experienced trader or just getting started, grasping the intricacies of the ascending triangle pattern can improve your trading strategy.
This blog post will discuss the pros and cons of the ascending triangle pattern and how to recognize this pattern. Let us discover how this pattern can assist us in navigating financial markets.
Ascending Triangle Chart Pattern – An Overview
An ascending triangle chart pattern is a bullish chart pattern that occurs when a stock’s price is unable to break a resistance level while the asset price consistently makes higher lows. This creates a triangle shape on the chart. When the price goes above the resistance level, it signals a possible bullish trend. Traders often enter long positions at or near the breakout point.
Ascending triangle chart pattern has the following characteristics:
- Resistance Level – The horizontal line represents the resistance level the price repeatedly fails to break above.
- Rising Support – The upward-sloping line shows the rising support level formed by connecting the successive higher lows.
- Convergence – The resistance and support lines converge as time passes, creating a narrowing triangle shape.
- Breakout – The price eventually breaks above the resistance level, signaling a bullish trend reversal.
Additionally, it is important to remember that no technical analysis pattern is 100% accurate. False breakouts can happen, and market conditions can change unexpectedly. The Ascending Triangle chart pattern should be used in combination with other technical indicators and risk management strategies.
Interpretation
The triangle signifies a phase of consolidation or accumulation. During this phase, buyers gradually gain control, causing prices to rise. The triangle formation displays strong buying pressure, and the price usually breaks out above the resistance level.
When the price breaks above the resistance level, it signals a bullish trend. The narrowing triangle suggests there could be a breakout soon. Furthermore, sometimes, the price may break above the resistance level only to reverse direction, resulting in a false breakout.
Read Also: List of Best Swing Trading Patterns
How to determine the Target and Stop-Loss?
A stop-loss order below is set on the recent low point of the support line in the ascending triangle. This helps to limit the losses if the trend reverses and the price moves downwards after a breakout. The risk per trade is determined by the difference between the entry price and the stop-loss level. Traders can change the stop-loss orders according to their risk tolerance and the market conditions.
A common way to set a target is to measure the triangle’s height and add it to the breakout point. Traders assume the price will move at least equal to the height of the triangle.
Example
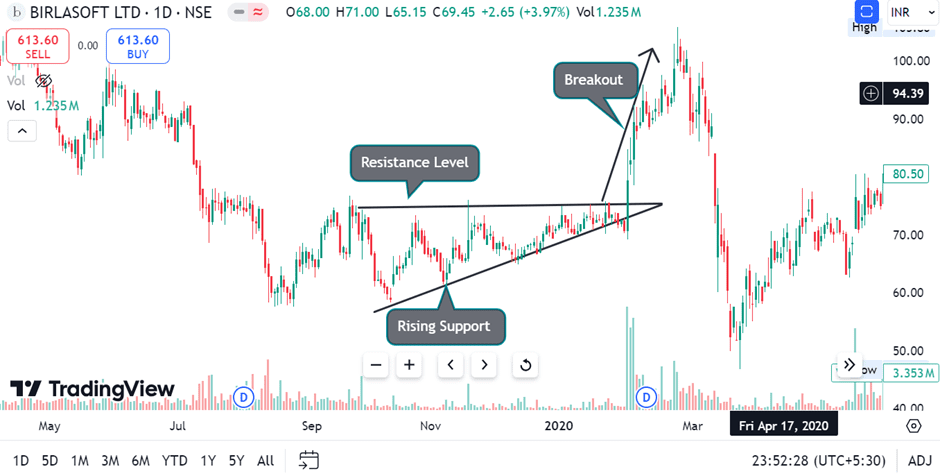
The above image shows that the stock entered a consolidation phase in September 2019 and remained in this phase until February 2020, characterized by similar highs and higher lows. The asset price broke out at a price level of INR 75 and made a high of INR 105.80, which was slightly more than the height of the triangle.
Advantages of Ascending Triangle Chart Pattern
Ascending Triangle chart pattern has the following advantages:
- Pre-defined entry and exit points – The pattern gives clear entry signals when the price breaks out above the resistance line. Stop-loss orders should be placed below the rising trendline to exit trades.
- Reliable – The ascending triangle pattern is quite reliable, especially in strongly trending markets. Confirmation from other technical indicators can increase traders’ confidence.
- Versatile Usage –The pattern can be used in different time frames, from intraday to weekly or monthly charts.
- Predictability – Once the triangle forms, it can provide a sense of predictability, allowing traders to anticipate the possible price movements.
Limitations of Ascending Triangle Chart Pattern
Ascending Triangle chart pattern has the following limitations:
- False Breakouts – One of the main drawbacks of the ascending triangle pattern is the potential false breakouts. Sometimes, the price briefly goes above the resistance level and then falls back, which can lead to losses.
- Subjectivity – Identifying an ascending triangle pattern can be somewhat subjective. Different traders might draw trendlines differently or may have varying criteria for what constitutes a valid pattern, causing inconsistencies in its application.
- Not Always Predictive – Although the pattern suggests that the trend will likely continue, it can’t be 100% accurate. Regardless of the pattern, market conditions, news events, or other factors can cause unexpected price movements.
Read Also: What is the Flag and Pole Pattern?
Conclusion
The Ascending Triangle chart pattern is useful for technical analysts as it predicts bullish trends with a fair amount of accuracy. Although the ascending triangle pattern has its own merits, it is important to combine it with other technical indicators and risk management strategies. Unexpected changes in market conditions can lead to false breakouts and result in losses. Therefore, traders should constantly monitor and adapt to any developments or shifts in market dynamics. Individuals can also consult a financial advisor before trading.
Frequently Asked Questions (FAQs)
Can ascending triangle patterns be used in all market conditions?
Ascending triangle patterns are most effective when used in uptrend or sideways markets.
Are there other chart patterns similar to ascending triangles?
Chart patterns that feature a triangle pattern are descending triangles and symmetrical triangles.
How do you recognize an ascending triangle pattern?
Look for a horizontal resistance line and a series of higher lows forming an upward-sloping support line. If the two trend lines are converging, it can signal that an Ascending Triangle chart pattern is forming.
What does a breakout above the resistance level indicate?
A breakout above the resistance level indicates a bullish trend continuation.
Can an ascending triangle be a bearish pattern?
No, ascending triangles are generally considered bullish patterns.
Disclaimer
The securities, funds, and strategies discussed in this blog are provided for informational purposes only. They do not represent endorsements or recommendations. Investors should conduct their own research and seek professional advice before making any investment decisions.