
| Type | Description | Contributor | Date |
|---|---|---|---|
| Post created | Pocketful Team | Aug-28-24 | |
| Add new links | Nisha | Mar-18-25 |
Read Next![]()
- MCX Trading: What is it? MCX Meaning, Features & More
- Top 10 Intraday Trading Strategies & Tips for Beginners
- How to Use Pivot Points in Intraday Trading?
- What is Intraday Trading?
- Understanding Intraday Trading Timings
- How to Choose Stocks for Intraday the Right Way?
- Blending Candlestick Patterns: How It Works, Benefits & Drawbacks
- Market Order Vs Limit Order: What’s the Difference?
- Silver Futures Trading – Meaning, Benefits and Risks
- What is Crude Oil Trading and How Does it Work?
- Top Algorithmic Trading Strategies of 2025
- What is Paper Gold? – Meaning, Types, & Benefits
- What is Algo Trading?
- What is Tick Trading? Meaning & How Does it Work?
- Rising Window Candlestick Pattern
- Black Candle Pattern
- Piercing Pattern
- High-Wave Candlestick Chart Pattern
- Closing Black Marubozu Candle
- What is the Best Time Frame for Swing Trading?

- Blog
- trading
- chart patterns
- broadening top
Broadening Top Chart Pattern
|
|
Broadening Top chart pattern is a complex and one of the most time-consuming patterns in technical analysis. It can give a breakout in either direction and is essentially a volatility play. The Broadening Top chart pattern looks a lot like a megaphone and is thus also popular as the Megaphone Top chart pattern.
In this blog, we will discuss the Broadening Top chart pattern, its interpretation, trading setups, advantages, and limitations with the help of examples.
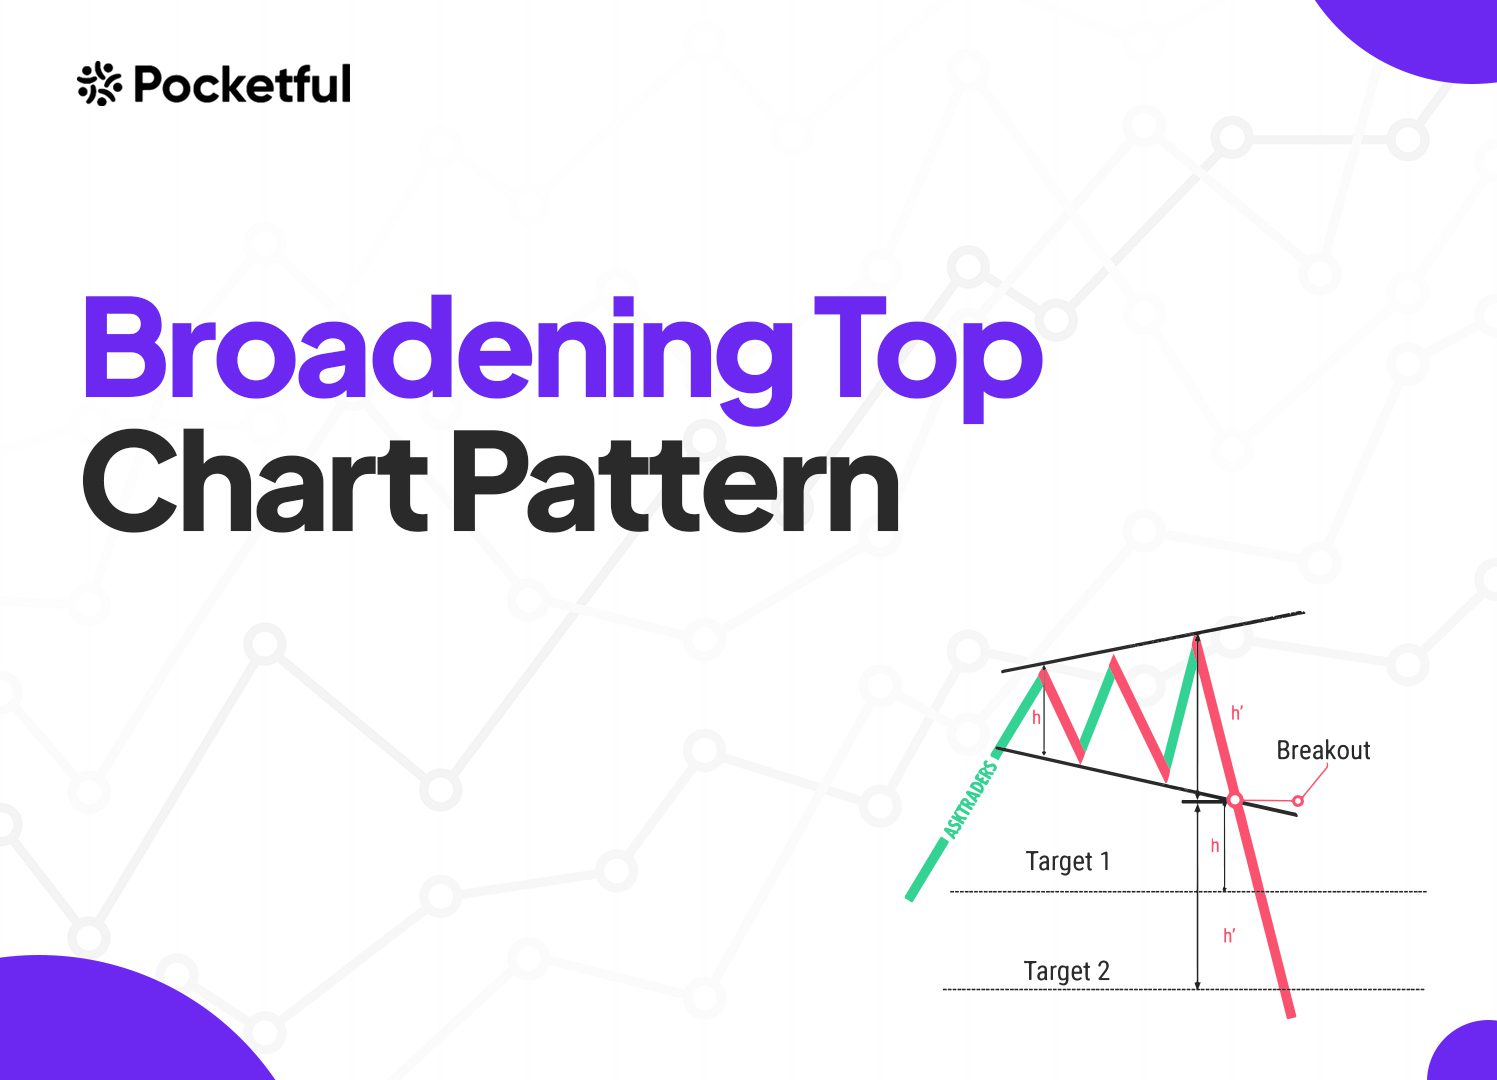
What is the Broadening Top Chart Pattern?
A Broadening Top chart pattern, also known as a Megaphone Top chart pattern, is characterized by increasing volatility and a series of higher highs and lower lows. It can act as a reversal pattern, which indicates a change of trend from bullish to bearish because it appears after a strong uptrend. The asset price usually gives a bearish breakout after the uptrend. However, it can also give a bullish breakout, categorizing it as a continuation pattern.
Pattern Interpretation
When interpreting the Broadening Top chart pattern, the following key points must be considered:
- Formation: The pattern occurs after a strong trend, with volatile price swings. The pattern consists of at least two higher highs and two lower lows.
- Price Action: Price swings become increasingly volatile, reflecting increasing market indecisiveness.
- Market Sentiments: It often occurs near the end of a prolonged uptrend, as the market struggles to find direction, indicating uncertainty prevails in the market.
- Volume: Volumes can also be erratic during the formation of the pattern. However, look for an increase in volume when a breakout occurs for a strong confirmation.
- Breakout: The pattern can give a breakout in either direction; it is generally considered a bearish reversal pattern when the price breaks below the lower trendline.
- Risk Management: Proper stop-loss and risk-management strategies are crucial due to volatile price fluctuations.
Trading Setup
A trading setup consists of a precise plan for entry, stop-loss, and target levels, which are discussed as follows:
- Entry Point: The entry point should be when the price moves above the resistance level or moves below the support level. Traders should also look for an increase in volumes when a breakout occurs.
- Stop Loss: A stop loss should be placed ideally below the lowest point of the Broadening Top pattern or below the big breaking candle to manage risk.
- Target: Measure the difference between the highest and lowest points in the Broadening Top chart pattern. Find the breakout point where the price first breaks the resistance or support and add that distance to the breakout price to get the target price.
Key points to remember while taking entry and setting stop-loss levels are:
- Buy/Sell on breakout: Buy the security when the price gives a breakout above the resistance level or sell the security when the price gives a breakout below the support level.
- Buy/sell on pullback: If you are unable to enter the trade when a breakout occurs, wait for a pullback to enter the trade.
- Set stop-loss: Stop-loss levels can be set just below the upper trendline in case of a bullish breakout or just above the lower trendline in case of a bearish breakout. However, caution must be taken as stop-loss levels can be hit due to volatile market conditions before the actual trend occurs.
Example 1: Broadening Top Chart Pattern of Reliance Industries Ltd.
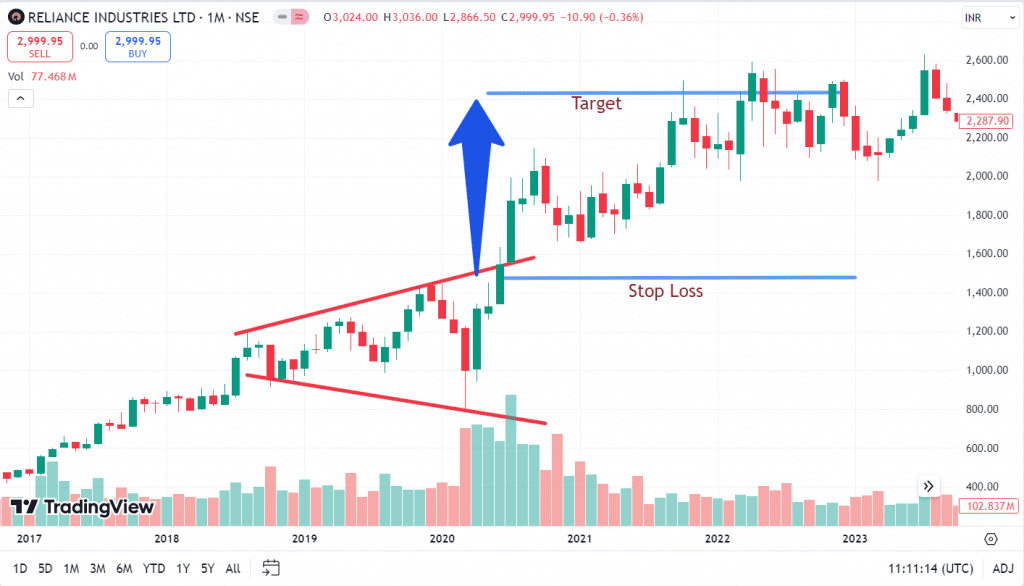
The above image shows a monthly chart of Reliance Industries, which was in an uptrend for some time before forming a Broadening Top chart pattern. The stock made three consecutive highs starting from August 2018, April 2019, and December 2019 and then made a low of 914 and 787 in October 2018 and March 2020, respectively.
Measure the distance between the lowest and highest point of the Broadening Top chart pattern and add it to the breakout price level to get a target price level. The high was 1,637, and the low was 787, which gives a target of 850 points above the breakout point of 1,637, which gives us around 2,487 or 2,500 target levels. We see a bullish breakout with big volumes in June 2020, hit the target in April 2022, and reached a high of 2,593. Its current market price is INR 3,000, which is way above the target. Stop-loss should be trailing, or keep the stop-loss below the big candle that broke the resistance.
Example 2: Running Example of Broadening Top Chart Pattern of Adani Ports & SEZ Ltd.
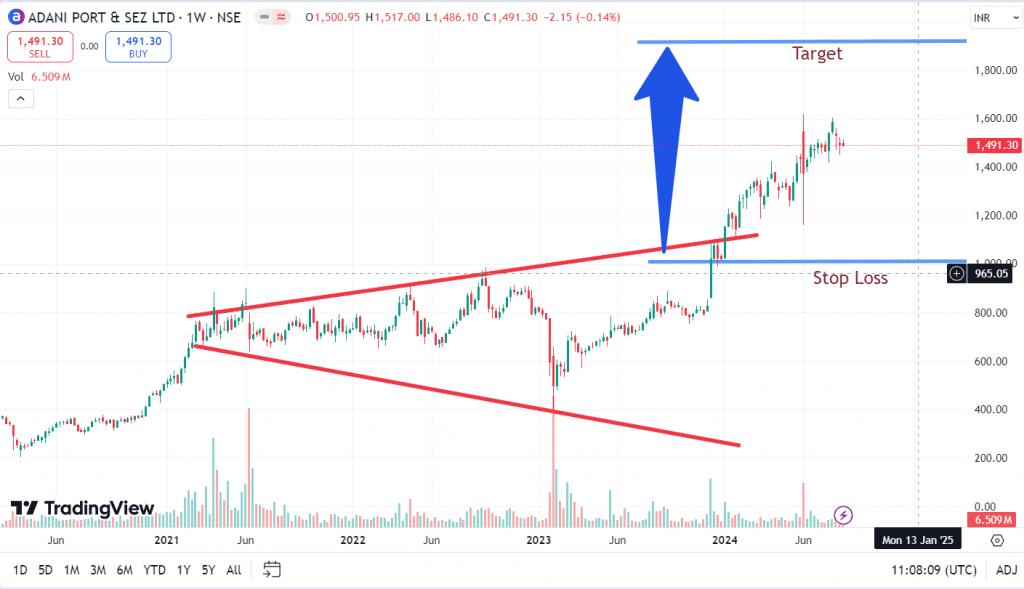
The above image shows a weekly chart of Adani Ports & SEZ Ltd., which has already given a bullish breakout. The stop-loss is set just below the trend line. The high and the low points are 395 and 1,160 in the Broadening Top chart pattern. This gives us a target of 765 points above the breakout point of 1,154, giving us a target level of 1,919. The current market price is INR 1,491, and it would be interesting to see how it will perform in the near future. SL should be below the big candle that broke the resistance.
Read Also: Double Bottom Reversal Chart Pattern
Advantages of Broadening Top Pattern
The advantages of the Broadening Top chart pattern are:
- It works in any market, e.g., equity, currency, or commodity markets.
- It works in any timeframe, but a bigger time frame means a strong trend is about to start.
- It can be used as a reversal signal indicator.
- It can be used as a volatility indicator.
- The pattern can be used to capture large moves.
- This pattern provides a complete setup for entry, stop loss, and target.
- This pattern gives quite accurate results if the breakout occurs with huge volumes.
Limitations of Broadening Top chart pattern
The limitations of the Broadening Top chart pattern are:
- It is a complicated pattern, and traders need some experience to use it.
- The interpretation of signals can be subjective as it is a complex pattern.
- It is a time-consuming pattern and may take several months or even years to form.
- The pattern could give a false breakout, which can result in losses.
- The pattern could be affected by various market factors like volatility, news, policy change, political instability, etc.
Read Also: What Is the Pennant Chart Pattern?
Conclusion
Broadening Top chart pattern is a powerful technical tool for investors and traders alike, although it is risky as volatile price fluctuations occur during its formation. Unexpected price swings occur in both directions, which shows the indecisiveness of the investors, but it offers a potential for significant gains after a breakout. Generally, we get a bearish trend reversal pattern, and bullish breakouts are rare. The Broadening Top chart pattern is a tough pattern to master. Hence, it is very important to understand the pattern’s characteristics, trade setup, and risk management before investing using this pattern. It is always advisable to consult a financial advisor before investing.
Frequently Asked Questions (FAQs)
Q1. What Does the Broadening Top chart pattern Indicate?
It indicates an increase in market uncertainty and volatility. It suggests a potential reversal of the prevailing trend in most cases.
What is the success rate of the Broadening Top chart pattern?
It depends upon the market conditions and time frames; the longer the time frame (Weeks, Months, or Years), the higher the success rate.
Can the Broadening Top chart pattern fail?
Like any other chart pattern, this pattern can fail, particularly if the breakout is weak with low volumes or market conditions and news contradicts the pattern signal.
How do we calculate the stop loss level for the Broadening Top chart pattern?
Individuals can consider the stop-loss levels just below the breakout candle in case of a bullish breakout and just above the breakout candle in case of a bearish breakout.
How do we calculate the target price for the Broadening Top chart pattern?
Individuals can calculate the difference between the high and low points of the Broadening Top chart pattern and add it to the breakout price to get the target price.
Disclaimer
The securities, funds, and strategies discussed in this blog are provided for informational purposes only. They do not represent endorsements or recommendations. Investors should conduct their own research and seek professional advice before making any investment decisions.