| Type | Description | Contributor | Date |
|---|---|---|---|
| Post created | Pocketful Team | Sep-05-24 | |
| Add new links | Nisha | Mar-18-25 |

- Blog
- trading
- chart patterns
- bump and run reversal
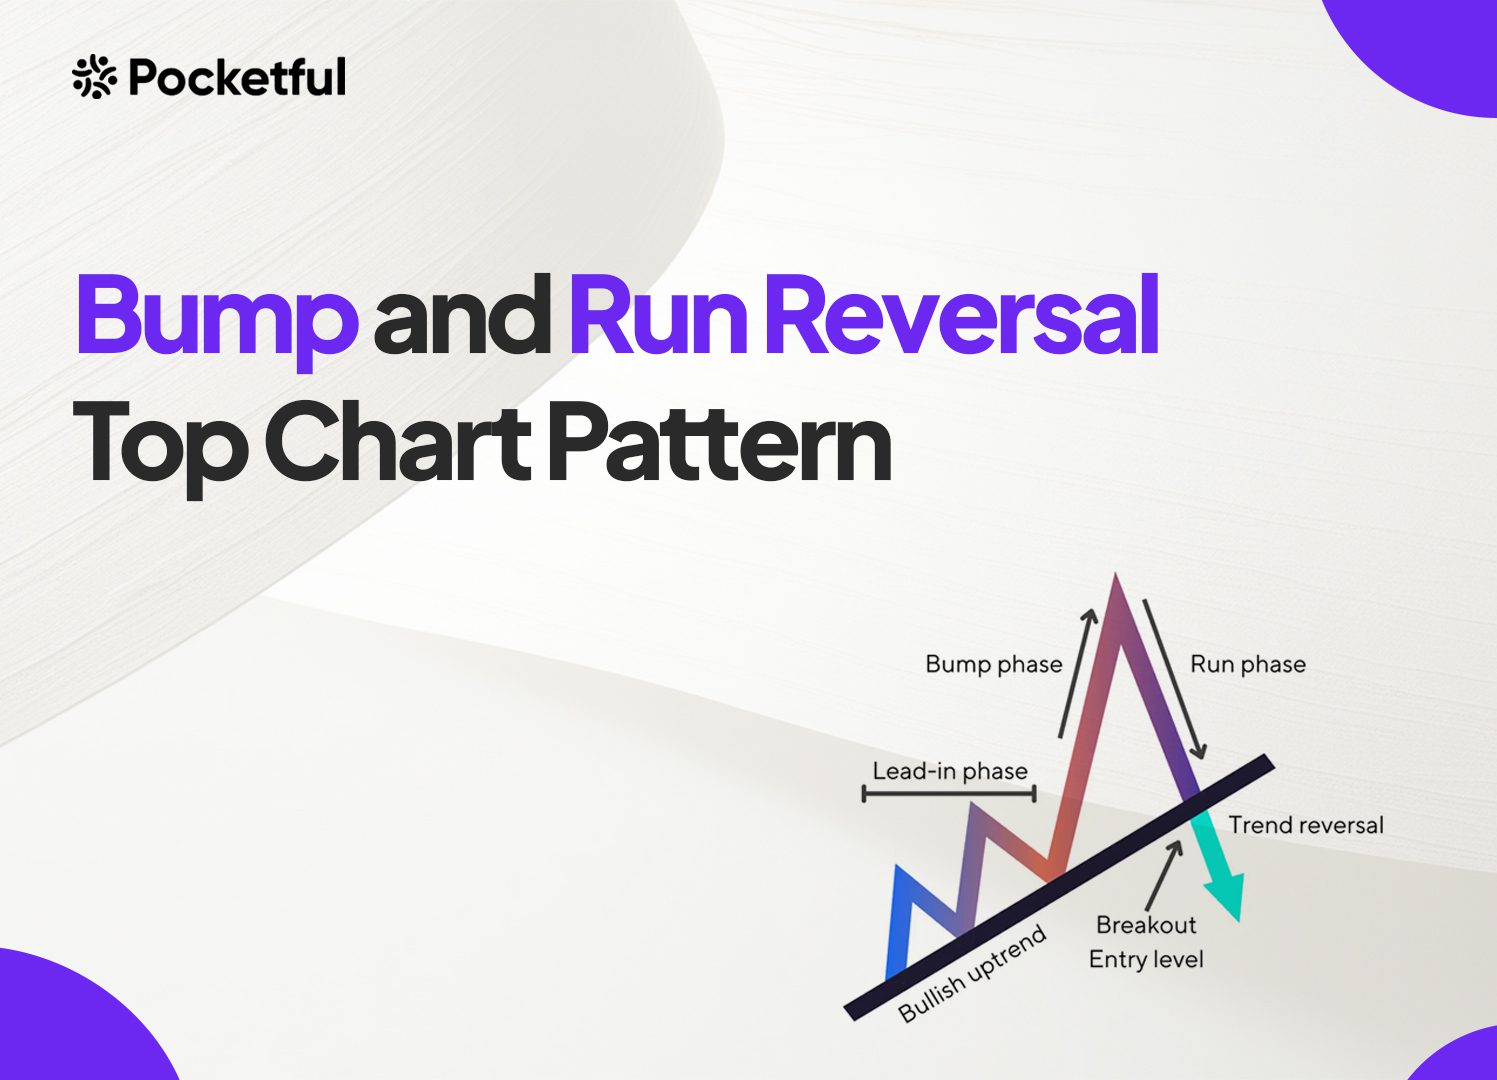
Bump and Run Reversal Top Chart Pattern

From a steady climb to a sharp decline, the Bump and Run Reversal Top pattern indicates the “End of the Bull Run.”
The Bump and Run Reversal Top Chart pattern is a bearish reversal pattern. It forms when the market is in an overly bullish trend, and prices suddenly advance to higher levels in a frantic manner. Once the pattern is confirmed, it suggests that the market trend is expected to reverse from bullish to bearish. In today’s blog, we will discuss the Bump and Run Reversal Top chart pattern, trading setup, advantages, and disadvantages.
What is the Bump and Run Reversal Top Chart Pattern?
The Bump and Run Reversal Top is a chart pattern that forms after a bull run or excessive uptrend in the stock price, which is too fast. The pattern generally indicates a change of trend from bullish to bearish. The pattern was first identified by Thomas Bulkowski and was introduced in the June 1997 issue of a journal called “Technical Analysis of Stocks and Commodities.” It was also included in his book, the “Encyclopedia of Chart Patterns.”
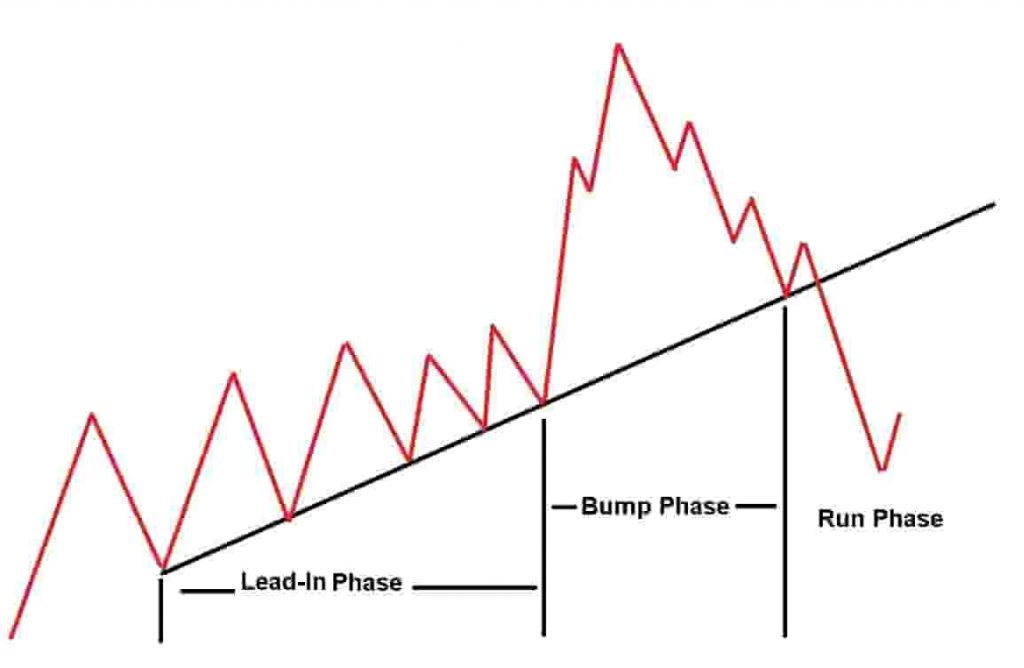
The three main phases of the pattern are explained below:
- Lead-in Phase: The lead-in phase is characterized by a steady upward trend with a moderate slope. The asset price trends higher in this phase, roughly at an angle of 30 degrees to 45 degrees on the chart.
- Bump Phase: In this phase, the price of an asset sharply increases and deviates significantly from the initial trendline, often due to excessive speculation. The asset price starts to trend even higher with a steeper angle, typically between 45 degrees and 60 degrees.
- Run Phase: The price peaks, then reverses sharply, breaking below the original trendline, signaling the start of a bearish trend. The pattern is complete once the asset price moves below the original trendline, acting as a support.
This pattern helps traders recognize when a bullish trend may come to an end, offering opportunities to exit long positions or to enter short positions.

How to Find the Bump and Run Reversal Top Chart Pattern?
The methods for finding a Bump and Run Reversal Top pattern in the market are:
- Use a percentage scanner: Use a percentage gainer stock scanner or tool to scan for trading opportunities and find the stocks that have appreciated significantly. Then, glance through the charts to find stocks about to enter the bump phase.
- Manually browse the price charts: Manually check the price charts to find the Bump and Run Reversal Top pattern.
Trading Setup
A trading setup consists of a precise plan for entry, stop-loss, and target levels, which are discussed as follows:
- Entry Point: The entry point should be when the price breaks below the trendline formed during the Lead-in phase. Create a short position once the price moves below the trendline. An increase in volume during the breakdown can be used as a confirmation signal.
- Stop-loss: A stop-loss should be placed ideally just above the bump peak or above the most recent high before the breakdown to manage risk.
- Target: Measure the vertical distance between the bump’s peak and the trendline. Find the breakdown point where the price first breaks the support and then subtract the distance from the breakdown price to get the target price.
Read Also: Broadening Top Chart Pattern
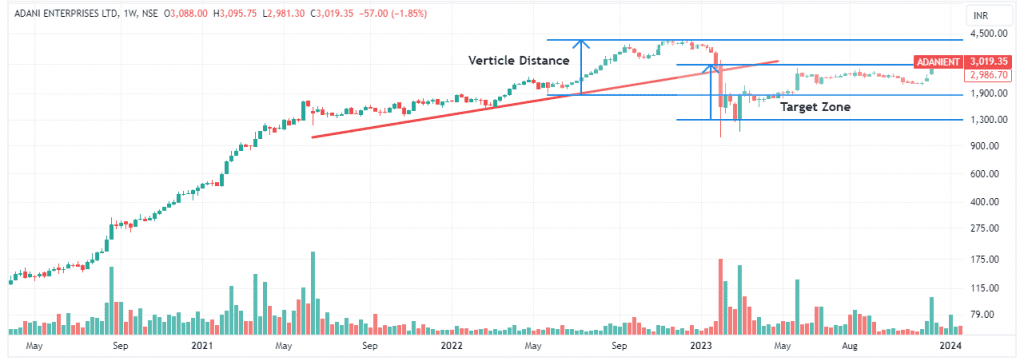
Example: Bump and Run Reversal Top Chart Pattern of Adani Enterprises Ltd.

The above image shows Adani Enterprises’ weekly chart. The stock was in an uptrend for some time, and then it started making a Bump and Run Reversal Top chart pattern when the stock price was in the Lead-in phase from June 2021 to May 2022. The stock price witnessed a sharp uptrend between May 2022 and November 2022 and went from a low of 1900 to a high of 4,096 in a speculative uptrend during the Bump phase. The stock price started falling with big volumes and gave a breakdown below the initial trend line in January 2023. The height of the bump is approximately 2,200, which is subtracted from the breakdown point of INR 3,019 to get an approximate target of INR 819. The stock almost achieves the target price in a couple of weeks after the breakdown. Stop-loss should ideally be placed just above the peak of the bump. A more conservative stop-loss should be placed just above the most recent high before the breakdown.
Advantages of Bump and Run Reversal Top Chart Pattern
The advantages of the Bump and Run Reversal Top chart pattern are:
- It works in any market, such as equity, currency, or commodity markets.
- It works in any time frame, but a pattern formation on a bigger time frame means a strong trend reversal is expected.
- The pattern can be used as a reversal indicator.
- The pattern can be used to capture large price movements.
- The pattern provides a logical understanding of price action.
- The pattern can be used to identify opportunities to short an asset in the market.
- This pattern gives quite accurate results if the breakdown occurs with strong volumes.
Limitations of Bump and Run Reversal Top Chart Pattern
The limitations of the Bump and Run Reversal Top chart pattern are:
- It is a complicated pattern and needs some expertise to trade.
- Pattern interpretation can be subjective, as it is one of the confusing and complex patterns.
- It is a time-consuming pattern.
- The pattern could give a false breakdown, which can result in losses.
- The pattern could be affected by various market factors such as volatility, news, policy change, political instability, or any other factor.
Read Also: Chart Patterns All Traders Should Know
Conclusion
The Bump and Run Reversal Top chart pattern is a powerful technical tool for investors and traders. Though it is a time-consuming pattern, once breakdown occurs after a strong trend with good volume, it offers a potential for significant gains. The pattern is divided into three phases: Lead-in phase, Bump Phase, and Run Phase. It is important to understand the pattern’s characteristics, trade setup, and risk management strategies before using this pattern to make informed decisions and improve the chances of success in the markets.
Frequently Asked Questions (FAQs)
How does the Bump and Run Reversal Top pattern differ from other reversal patterns?
Other reversal patterns, such as Head and Shoulders or Double Top, have specific formations, but the Bump and Run Reversal Top pattern follows a trendline formed during the Lead-in phase. Furthermore, it is difficult to estimate the duration of each phase.
Can the Bump and Run Reversal Top pattern lead to a long-term trend reversal?
Yes, it can signal the start of a long-term bearish trend on a longer timeframe (e.g., weekly or monthly). However, in a short timeframe, it may only indicate a temporary correction.
What are the risks of trading the Bump and Run Reversal Top pattern?
The primary risk associated with the Bump and Run Reversal Top pattern is a false breakdown when the price temporarily moves below the trendline but then resumes the uptrend. To lower this risk, traders should check volumes for confirmation or use additional indicators to validate the reversal.
Is the Bump and Run Reversal Top pattern reliable?
The Bump and Run Reversal Top pattern can be reliable, especially when confirmed by volume and other technical indicators.
Disclaimer
The securities, funds, and strategies discussed in this blog are provided for informational purposes only. They do not represent endorsements or recommendations. Investors should conduct their own research and seek professional advice before making any investment decisions.