
| Type | Description | Contributor | Date |
|---|---|---|---|
| Post created | Pocketful Team | Sep-03-24 | |
| Add new links | Nisha | Mar-18-25 |
Read Next![]()
- MCX Trading: What is it? MCX Meaning, Features & More
- Top 10 Intraday Trading Strategies & Tips for Beginners
- How to Use Pivot Points in Intraday Trading?
- What is Intraday Trading?
- Understanding Intraday Trading Timings
- How to Choose Stocks for Intraday the Right Way?
- Blending Candlestick Patterns: How It Works, Benefits & Drawbacks
- Market Order Vs Limit Order: What’s the Difference?
- Silver Futures Trading – Meaning, Benefits and Risks
- What is Crude Oil Trading and How Does it Work?
- Top Algorithmic Trading Strategies of 2025
- What is Paper Gold? – Meaning, Types, & Benefits
- What is Algo Trading?
- What is Tick Trading? Meaning & How Does it Work?
- Rising Window Candlestick Pattern
- Black Candle Pattern
- Piercing Pattern
- High-Wave Candlestick Chart Pattern
- Closing Black Marubozu Candle
- What is the Best Time Frame for Swing Trading?

- Blog
- trading
- chart patterns
- descending channel
Descending Channel Pattern
|
|
Are you interested in elevating your proficiency in technical analysis? Descending Channel pattern provides a structured approach for identifying downtrends and presents profit opportunities in financial markets.
In today’s blog, we will learn about the intricacies of the descending channel pattern and how a trader can interpret it.
What is a Descending Channel Pattern?
The descending channel pattern is a technical analysis chart pattern that indicates a possible reversal towards a bearish trend. It can be observed as a sequence of declining peaks and troughs, creating a channel exhibiting a downward slope.
When a clear breakdown occurs, it is advisable to enter a short position to capitalize on the ongoing downward trend and maximize profits.
Remember that a narrower channel often showcases a stronger trend and a higher probability of a breakout.
Interpretation Of Descending Channel Pattern
A Descending channel chart pattern has the following phases:
- Downward Slope – The upper and lower trend lines move parallel to each other in a downward direction, creating a narrow channel.
- Price Action – The price should repeatedly rebound from both the upper and lower trendlines.
- Lower Highs and Lower Lows – Each new high is lower than the previous one, and each new low is also lower than the previous one.
- Breakdown Alert – This pattern is generally considered to have given a breakdown when the price falls below the lower trendline, which signals the continuation of the bearish trend.
Additionally, it is suggested to be cautious of false breakdowns, where the price briefly breaks below the lower trendline but then reverses.
How to Determine Target & Stop Loss?
Extend the lower trendline to project a possible target price. This is based on the premise that the price will continue to decrease and remain within the channel.
You can also search for previous support and resistance levels within the channel that could serve as targets. These levels can be identified using horizontal lines or technical indicators.
In case of a breakdown, set a stop-loss above the most recent high within the channel. This ensures the trade is closed if the price reverses and moves above the upper trendline.
Furthermore, assess your risk tolerance and establish an appropriate stop-loss level. For instance, if you are willing to risk 2% of your account balance on a trade, adjust your stop-loss accordingly or decrease your position size.
Read Also: Ascending Channel Pattern
Example Descending Channel Pattern
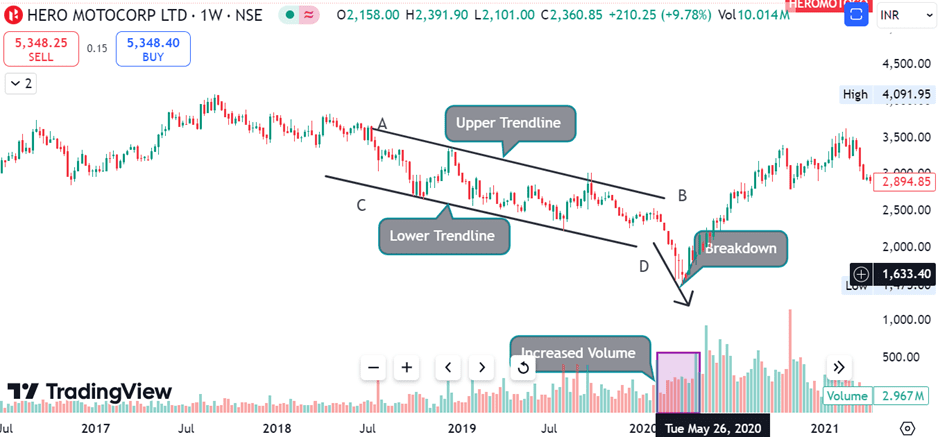
The image above is the weekly chart of ‘Hero MotoCorp Limited.’
It is evident from the chart that the price has been declining over the past few weeks, forming a series of lower highs and lower lows. Upon closer inspection, you can see two downward-sloping trend lines: the Upper Trendline, where the price has repeatedly been rejected, depicting resistance, and the Lower Trendline, where the price has found support several times, preventing further declines.
The price oscillates between these two trendlines, creating a descending wedge or channel shape. As soon as it breaks below the lower trendline with increased volume, traders will enter a short position, considering it a bearish breakdown.
Advantages of Descending Channel Pattern
The advantages of the Descending Channel pattern are:
- Clear Indication of a Trend – It offers a visually distinct representation of a bearish trend. This makes it easier for traders to recognize the ongoing trend and make better trading decisions.
- Risk Management – Traders can limit potential losses by using stop-loss orders based on the upper trendline if the price reverses unexpectedly after giving a breakdown below the lower trendline.
- Simple – This pattern is relatively easy to use and implement.
Limitations of Descending Channel Pattern
The limitations of the Descending Channel pattern are:
- False Breakdowns – At times, prices may temporarily breach the lower trendline but swiftly rebound, causing a false breakdown. This situation can result in losses for traders who enter short positions too early.
- Subjectivity – Different traders may draw trend lines with slight variations, resulting in different interpretations of the pattern.
- Need for Confirmation – Confirmation is required before entering a trade when there is a breakdown below the lower trendline. You may need to wait for a retest of the lower trendline or look at other technical indicators for better accuracy.
Read Also: Falling Wedge Pattern: Meaning & Trading Features
Conclusion
To summarize, the descending channel pattern is an incredibly powerful tool in technical analysis. It provides traders a reliable method to identify bearish trends and possible reversal points. Understanding the formation of this pattern can help traders enhance their ability to navigate markets effectively. However, it may still produce false signals, especially in volatile markets where price fluctuations can be erratic and unpredictable. Traders should always use additional analysis and risk management strategies to validate their trading decisions. Eventually, a trader should always remember that patience and discipline are integral components to succeed in trading. It is advisable to consult a financial advisor before trading.
Frequently Asked Questions (FAQs)
What is the difference between a Descending Channel and a Triangle pattern?
Both patterns are bearish, but a triangle has converging trend lines that meet at a point, and the channel has parallel trendlines.
Can a Descending Channel pattern give a bullish reversal?
A bullish breakout above the upper trendline can hint at a possible reversal of the bearish trend.
What role does volume play in a Descending Channel pattern?
Decreasing volume within the channel shows weakening momentum, and a spike in volume during the breakout can confirm the move.
Is the Descending Channel pattern applicable to all time frames?
The pattern can be used in different timeframes, including daily, weekly, monthly, etc.
How can I improve my accuracy in trading the Descending Channel pattern?
A trader can increase accuracy by using other technical indicators with the Descending Channel pattern.
Disclaimer
The securities, funds, and strategies discussed in this blog are provided for informational purposes only. They do not represent endorsements or recommendations. Investors should conduct their own research and seek professional advice before making any investment decisions.