
| Type | Description | Contributor | Date |
|---|---|---|---|
| Post created | Pocketful Team | Jul-09-24 | |
| Add new links | Nisha | Mar-18-25 |
Read Next![]()
- Top 10 Intraday Trading Strategies & Tips for Beginners
- How to Use Pivot Points in Intraday Trading?
- What is Intraday Trading?
- Understanding Intraday Trading Timings
- How to Choose Stocks for Intraday the Right Way?
- Blending Candlestick Patterns: How It Works, Benefits & Drawbacks
- Market Order Vs Limit Order: What’s the Difference?
- Silver Futures Trading – Meaning, Benefits and Risks
- What is Crude Oil Trading and How Does it Work?
- Top Algorithmic Trading Strategies of 2025
- What is Paper Gold? – Meaning, Types, & Benefits
- What is Algo Trading?
- What is Tick Trading? Meaning & How Does it Work?
- Rising Window Candlestick Pattern
- Black Candle Pattern
- Piercing Pattern
- High-Wave Candlestick Chart Pattern
- Closing Black Marubozu Candle
- What is the Best Time Frame for Swing Trading?
- Downside Tasuki Gap Candlestick Pattern

- Blog
- trading
- chart patterns
- descending triangle
Descending Triangle Pattern in Stock Trading
|
|

Technical chart patterns are of significant importance in the trading world because they help traders forecast a specific stock’s expected future price movement. The descending triangle pattern is one of the many chart patterns that can be used for earning profits.
In today’s blog, we will discuss how to identify the descending triangle pattern, its features, advantages, and disadvantages.
What is a Descending Triangle?
A descending triangle pattern is characterized by an upper trend line that descends and a second, flatter horizontal trend line that emerges beneath the first line. The upper trendline connects a series of lower highs, and the lower trendline connects a series of lows. It is usually referred to as a continuation pattern with a downtrend. However, a descending triangle pattern can also give a bullish breakout, referred to as a reversal pattern.
Features of Descending Triangle Pattern
Descending triangle pattern has the following features:
- There must be an ongoing downtrend before the formation of this triangle pattern.
- The lower horizontal lines act as a support zone.
- A further downtrend can be expected when the breakdown is below the lower trendline.
- This pattern shows that stock demand is weakening or buyers are exiting their positions.
- An investor must be cautious before entering any trade based on this chart pattern, as a bullish reversal can be seen due to unexpected events.
Read Also: Symmetrical Triangle Chart Pattern
Identification of Descending Triangle Pattern
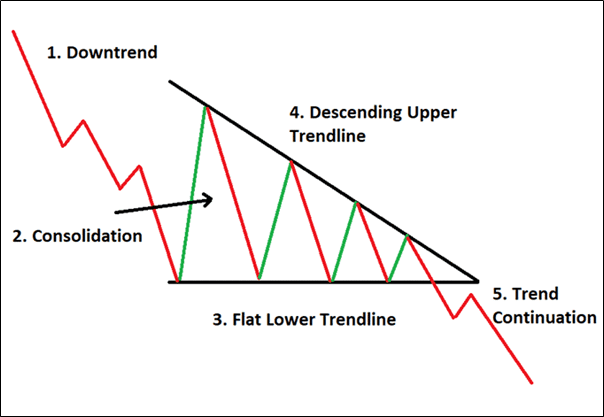
There will be five stages in which the whole identification process is divided.
- Downtrend: There must be an existing price downtrend before the formation of the pattern.
- Consolidation Phase: Under this phase, the stock prices will remain range-bound.
- Flat Lower Trend Line: This trend line is considered to be a support, and the prices often approach the level until the breakout occurs.
- Descending Upper Trend Line: When sellers try to push the price down, downward-sloping lines can be drawn by connecting the highs of the candlesticks.
- Continuation of Downtrend: If the breakout is given by the stock price below the lower trend line, then a bearish pattern will continue in the stock prices.
Interpretation of Descending Triangle Pattern
This pattern, seen as a bearish continuation pattern, shows that sellers are attempting to drive prices below the support level. The market’s attempt to recover from the support lines indicates that buyers are trying to gain control and push the prices up. The pattern indicates that selling pressure will intensify after the price breaches the horizontal support line in a downward direction.
Duration of Descending Triangle Pattern
The descending triangle pattern typically takes 28 days to become established and lasts no longer than 90 days. The trader primarily uses these patterns on the daily chart, which are usually analyzed over several months. A preceding trend, or downtrend, takes several months to build and frequently starts to take shape several months before the breakout.
Effectiveness of Descending Triangle Pattern
Traders regard it as one of the most reliable and successful trading patterns. It has an accuracy of 79% in predicting a downtrend with an average price decline of 16%. Tom Bulkowski’s study over 20 years shows that price moves by an average of more than 38% following the confirmation of a descending triangle pattern on the break of either side of the support or resistance line on the larger volume.
Advantages of Descending Triangle Pattern

Descending a triangle pattern has the following advantages:
- Traders use this pattern to create short positions once the price breaks below the lower trendline.
- When this pattern is used with other technical tools, it creates confidence among the investor.
- Risk can be managed using a proper stop loss when trading based on this chart pattern.
- The triangle’s widest part can be considered as the target after the breakdown is shown on the candlestick pattern.
Disadvantages of Descending Triangle Pattern
Descending triangle pattern has the following disadvantages:
- This pattern sometimes produces a false breakdown signal and creates a new support zone.
- This pattern is not very reliable in case of a bullish breakout.
- Low volumes after breakout can be an indication of a weak downtrend.
Read Also: Descending Channel Pattern
Conclusion
In conclusion, traders view the descending triangle pattern as a valuable tool that aids in determining the bearish momentum of a given asset. Investors are advised to combine this pattern with other accessible technical tools to reduce the probability of a false breakout. Traders can select their entry point based on the breakdown provided by the chart pattern and their stop loss and goal based on their risk profile.
Investors must consider position sizing and risk management while using a descending triangle pattern. Moreover, investors must consult a financial advisor before making investment decisions.
Frequently Asked Questions (FAQs)
Are descending triangles a reliable trading pattern?
A descending triangle pattern is considered reliable when it appears after an existing downtrend and is used with other technical patterns.
What will be the target of the descending triangle pattern?
The target price of the descending triangle pattern is calculated by subtracting the triangle’s height from the breakout point to determine the target price. The formula can be described as Target Price (TP) = Breakout Point (BP) – Height (H).
Is the descending triangle a continuation pattern?
The descending triangle is a bearish continuation pattern, typically appearing after an initial downtrend. It is followed by a consolidation phase and a downside breakdown.
How long does a descending triangle pattern take to form?
Formation of a descending triangle pattern generally takes several weeks to several months. The longer the pattern duration, the higher the probability of significant movement in price once breakdown occurs.
Is the descending triangle pattern considered reliable?
It is considered a reliable pattern as it has an accuracy of 79% in predicting a downtrend with an average price decline of 16%.
Disclaimer
The securities, funds, and strategies discussed in this blog are provided for informational purposes only. They do not represent endorsements or recommendations. Investors should conduct their own research and seek professional advice before making any investment decisions.