| Type | Description | Contributor | Date |
|---|---|---|---|
| Post created | Pocketful Team | Aug-28-24 | |
| Add new links | Nisha | Mar-18-25 |
Read Next![]()
- Best Apps & Tools for Option Chain Analysis in India
- Margin Trading vs Short Selling – Key Differences
- What is Delivery Trading?
- Benefits of Online Trading
- What is Forward Marketing?
- Best Brokers for Low Latency Trading in India 2025
- What is Trading on Equity?
- What is Volatility Arbitrage?
- How to Calculate F&O Turnover for Trading?
- What is an Underlying Asset?
- Collar Options Strategy – Meaning, Example & Benefits
- 10 Best Books on Commodity Trading
- Different Types of Derivatives in India
- What is Derivatives?
- Understanding Futures Pricing Formula
- What is Rollovers in Stock Market?
- What is Swaps Derivatives?
- Reverse Cash and Carry Arbitrage Explained
- What is Bermuda Option?
- What Is Black-Scholes Model: Meaning, Formula & Benefits

- Blog
- trading
- chart patterns
- double bottom reversal
Double Bottom Reversal Chart Pattern
Written by : Pocketful Team
|Updated by : Pocketful Team
Published on : 28th August 2024
|Updated on : 18th March 2025
Do you need a reliable technical analysis pattern to identify the market reversals? Consider the double-bottom reversal chart pattern. This classic chart pattern can predict a change from a downtrend to an uptrend, giving valuable insights to traders and investors.
In this blog, we will explore the Double Bottom reversal chart pattern, its main features, how to recognise it, and its importance for predicting market trends. Whether you are experienced or new to the markets, knowing this pattern can help you immensely in your trading journey.
What is a Double Bottom reversal Chart Pattern?
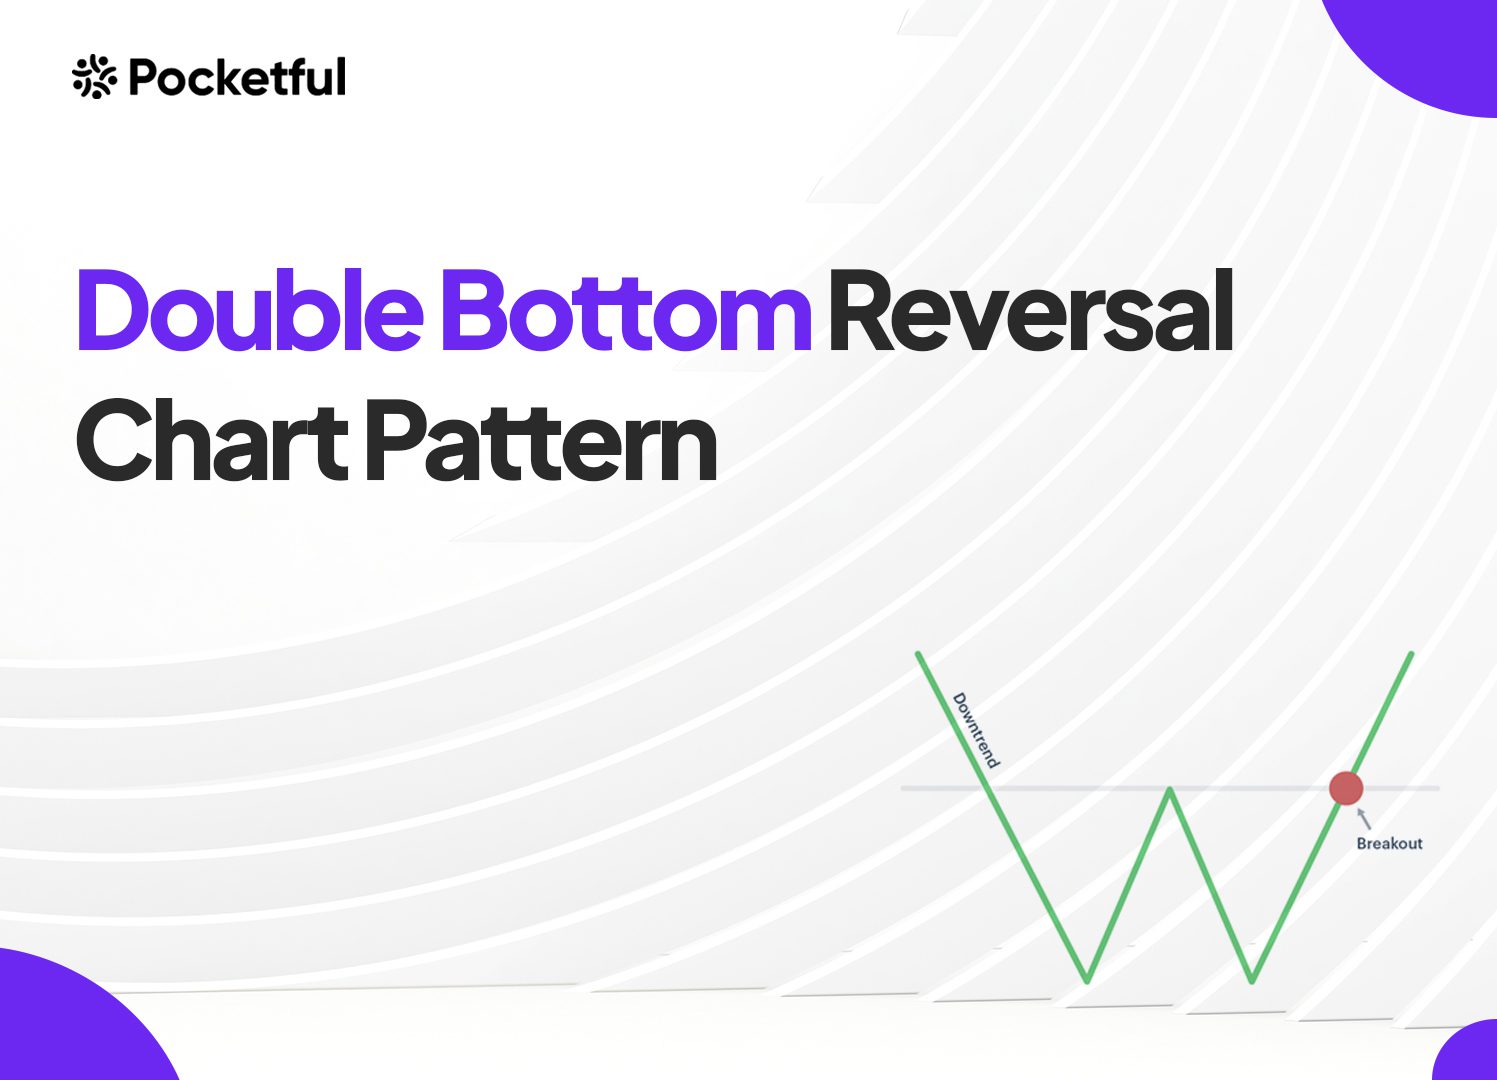
A Double Bottom reversal chart pattern can be used to predict a possible reversal of a downtrend. It is marked by two low points with nearly the same price, with a higher price point in between. The peak must be higher than the two low points, but it does not have to be a new high. This peak level between two lows represents the neckline or the resistance level.
Once these low points are identified, the trader can draw a trendline connecting them to create a support level. The support level indicates the levels from where the asset price may trend upwards.
Additionally, the trading volume should be low during the two low points, which shows that there is not much selling activity occurring. Increased trading volume at the highest point can mean a possible reversal.
Interpretation of the Pattern
A Double Bottom chart pattern is a bullish chart pattern that suggests that a downtrend may be coming to an end and can be recognised with the help of,
- Two Low Points: The price forms two successive bottoms that have approximately equal low points.
- Higher Top: Between the two low points, there is a higher top.
- Support: It is a horizontal line connecting the two low points. If the price doesn’t go below this line, it suggests that the downtrend is about to end.
- Resistance: The high point formed between the two low points represents a price level that will act as a resistance level.
How to determine the Target & Stop-Loss?
One common method to use is the ‘measured move’ technique. Measure the vertical distance from the neckline to the lowest low point. Then, add this distance to the breakout point, which is where the price breaks above the neckline.
A conservative stop-loss can be placed just below the neckline. This ensures that if the price moves back down below the neckline, the trade is squared off to reduce the losses.
Alternatively, a stop-loss can also be set just below the most recent low point before the breakout.
Read Also: Chart Patterns All Traders Should Know
Example

The chart above shows the formation of a Double Bottom Chart Pattern for Infosys stock on the daily timeframe. The chart has the following features:
- A & B are the two low points that are almost at the same price level.
- AB represents the support level.
- DE represents the resistance level.
- C is another point between two distinct low points, which is higher than points A & B.
Furthermore, we can see that after the breakout above the resistance level DE, the price retested the resistance level and moved upwards by a distance equal to the gap between AB and DE levels.
Advantages of Double Bottom Reversal Chart Pattern
The advantages of Double Bottom Reversal chart pattern are:
- Clear Reversal signal – When the price surpasses the resistance level, it gives a clear signal of a possible change from a downtrend to an uptrend. This can help investors find opportunities to buy stocks.
- Risk Management – Placing a stop-loss below the resistance level allows traders to effectively minimise losses if the pattern gives false signals.
- Simple – This pattern is easy to identify and understand, making it easy to use for traders of every level.
- Universal – The pattern works for different types of assets, like stocks, commodities, currencies, and cryptocurrencies.
Limitations of Double Bottom Reversal Chart Pattern
The limitations of Double Bottom Reversal chart pattern are:
- Subjectivity – Identifying the precise points of the two lows and the peak can be subjective, especially in volatile markets.
- False Breakouts – The price might break above the neckline but fail to continue its uptrend, resulting in a false breakout, which can result in losses.
- Market Conditions – The pattern might not work well in volatile markets due to economic or political events.
- Timeframe Sensitivity – The pattern’s effectiveness depends on the timeframe used. A double bottom on an hourly chart might not be as accurate as one on a daily, weekly or monthly chart.
Read Also: Double Top Reversal Chart Pattern
Conclusion
To summarise, the double bottom reversal chart pattern is an invaluable tool for identifying potential trend reversals. However, keeping a close eye on other indicators and signals, in addition to the double bottom pattern, can provide a more comprehensive view of the market and help confirm trend reversals because depending solely on one pattern may not yield profits in financial markets. It is always advisable to consult a financial advisor before investing.
Frequently Asked Questions (FAQ)
01
What is the importance of the neckline in a Double Bottom chart pattern?
The neckline acts as a resistance level, and a breakout above the neckline confirms the potential reversal.
02
What role does volume play in a Double Bottom chart pattern?
Increased volume during the breakout can strengthen the bullish trend.
03
Can Double Bottom chart pattern form on any timeframe?
Yes, the Double Bottom chart pattern can form on any timeframe, from daily to weekly or monthly charts.
04
Can a Double Bottom chart pattern fail?
Yes, a Double Bottom chart pattern can fail if the price fails to continue the uptrend after moving above the resistance level.
05
How can I improve my accuracy in recognising and trading the Double Bottom chart pattern?
Practising chart analysis, studying historical examples, and using other technical indicators with the Double Bottom chart pattern can help you improve your accuracy.
Disclaimer
The securities, funds, and strategies discussed in this blog are provided for informational purposes only. They do not represent endorsements or recommendations. Investors should conduct their own research and seek professional advice before making any investment decisions.
