
| Type | Description | Contributor | Date |
|---|---|---|---|
| Post created | Pocketful Team | Aug-27-24 | |
| Add new links | Nisha | Mar-18-25 |
Read Next![]()
- MCX Trading: What is it? MCX Meaning, Features & More
- Top 10 Intraday Trading Strategies & Tips for Beginners
- How to Use Pivot Points in Intraday Trading?
- What is Intraday Trading?
- Understanding Intraday Trading Timings
- How to Choose Stocks for Intraday the Right Way?
- Blending Candlestick Patterns: How It Works, Benefits & Drawbacks
- Market Order Vs Limit Order: What’s the Difference?
- Silver Futures Trading – Meaning, Benefits and Risks
- What is Crude Oil Trading and How Does it Work?
- Top Algorithmic Trading Strategies of 2025
- What is Paper Gold? – Meaning, Types, & Benefits
- What is Algo Trading?
- What is Tick Trading? Meaning & How Does it Work?
- Rising Window Candlestick Pattern
- Black Candle Pattern
- Piercing Pattern
- High-Wave Candlestick Chart Pattern
- Closing Black Marubozu Candle
- What is the Best Time Frame for Swing Trading?

- Blog
- trading
- chart patterns
- double top reversal
Double Top Reversal Chart Pattern
|
|

The financial markets form a vibrant landscape where trends constantly evolve. Understanding these shifts is important for making well-informed trading decisions. One such pattern that is a must-have in a technical analyst’s arsenal is the ‘Double Top Reversal Pattern.’ This pattern provides valuable insights into upcoming market reversals, helping traders recognize possible selling opportunities.
In this blog, we will discuss the double-top reversal chart pattern with the help of an example. Moreover, we will discuss the advantages and disadvantages of this pattern.
What is a Double-top Reversal Pattern?
A double top is a chart pattern used in technical analysis to signal a bearish reversal in an asset’s price. It is formed when the price of an asset reaches a high price twice consecutively, with a moderate decline between the two highs.
This pattern is often understood as a sign that buyers are losing their momentum and sellers might take control of the market soon. Traders often look for confirmation signals, such as a break below the neckline, to further validate the bearish reversal.
- Target Price: The price target is the same as the height from the neckline to the highest peak, projected downward from the neckline. An order to book profits can also be placed at the next support level.
- Stop-Loss Price: A stop-loss order can also be placed above the highest peak or just above the neckline to limit potential losses if the price moves higher.
Characteristics of Double Top Reversal Pattern
The double-top reversal pattern has the following characteristics:
- M-Shaped Pattern – The price chart forms an ‘M’ shape, with two different peaks at approximately the same price level.
- Moderate Decline – When the price reaches a high, retraces, and rallies back to a similar high after a minor decline.
- Confirmation – The pattern is confirmed when the price falls below the support level (neckline). Traders also use volume data to confirm pattern formation.
Read Also: Bump and Run Reversal Top Chart Pattern
Example of Double Top Reversal Pattern
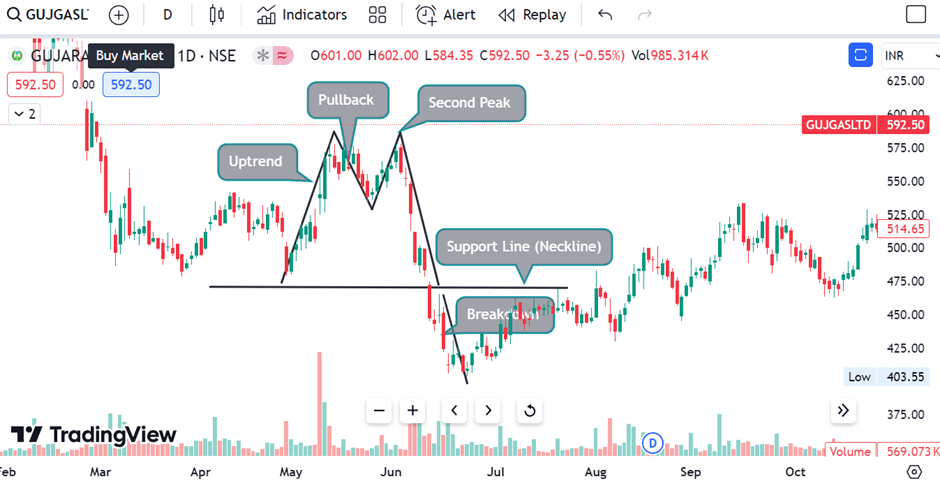
The example below shows the daily chart of Gujarat Gas Private Limited showing the Double Top Chart Pattern. The pattern shows the following phases:
- Upward Trend – The stock price experiences a strong upward trend, reaching a peak (the first top).
- Pullback – The price retraces slightly, indicating buyers are losing control.
- Second Peak – The price rallies again, almost reaching the same level as the first peak. (the second top).
- Support Line or Neckline– A horizontal line is drawn between the two lowest points between the peaks, forming the neckline.
- Breakdown – The price breaks below the neckline, confirming the double top pattern.
- Price Target – The height of the pattern, i.e., the distance between the support line and the peak, is projected downwards from the support to estimate the price target.
This is a simplified example, and real-world analysis considers factors like volume, technical indicators, and fundamental analysis. Not all double-top patterns lead to profitable trades, and individuals must be careful before making trading decisions.
Advantages of Double Top Reversal Pattern
A double-top reversal pattern has the following advantages:
- A clear sign of reversal – The pattern shows a possible change in the direction of the price. Traders can use this to predict a price decline.
- Definite Entry and Exit Points – The support line provides a clear entry point for short positions once it is broken. An individual can exit the trade if the price reaches the target price or moves upwards after breaking the support level.
- Risk Management – Patterns are often useful for establishing stop loss and target levels. Place a stop-loss above the highest peak and determine the profit target by projecting the pattern’s height downward from the support line.
- Objective Analysis – The double top pattern depends on price action and does not need subjective analysis, making it a comparatively objective tool.
Limitations of Double Top Reversal Pattern
A double-top reversal pattern has the following disadvantages:
- False Signals – Like any technical indicator, the double top reversal pattern can give incorrect signals. The price could briefly touch two high points before continuing its upward movement, causing traders who act too soon to lose money.
- Timing Concerns – Finding the best time to enter and exit a trade can be difficult. If the trader enters or exits too early, he might miss good opportunities or lose money.
- Confirmation Needed – Relying solely on the double top pattern without confirmation from other technical indicators or fundamental analysis can increase the risk of false signals and wrong entries.
- Limited Usefulness in Strong Uptrends – In a robust uptrend, the double-top pattern might be less reliable as the overall market momentum can override the pattern’s bearish implications.
Read Also: Double Bottom Reversal Chart Pattern
Conclusion
The Double Top Reversal pattern is a very useful pattern for identifying reversals in the financial market. Once you understand how it is formed and other trading concepts that work with this pattern, you’ll be well-placed to spot a bearish shot!
The Double Top Reversal pattern is a decent chart pattern with good accuracy but should be used with a stop-loss order to limit losses. An individual must also keep realistic targets to book profits. Nevertheless, always be sure to do plenty of research and perhaps consult with a financial advisor before you make any investment decisions.
Frequently Asked Questions (FAQs)
How is double top confirmed?
A double top is confirmed when the price breaks below the support level between the two peaks.
What does the pattern indicate?
A double top shows a loss of buying momentum and a possible increase in selling pressure.
How can I trade the double-top pattern?
Traders often short-sell after the price breaks below the support line. A stop-loss can be placed above the highest peak.
Are double-top patterns always accurate?
No, like any other technical pattern, a double-top reversal pattern can produce false signals. It is important to use it in combination with other indicators like volume.
Can double tops form in any timeframe?
Yes, the double top reversal pattern can form in any timeframe, from short-term to long-term timeframe.
Disclaimer
The securities, funds, and strategies discussed in this blog are provided for informational purposes only. They do not represent endorsements or recommendations. Investors should conduct their own research and seek professional advice before making any investment decisions.