
| Type | Description | Contributor | Date |
|---|---|---|---|
| Post created | Pocketful Team | Jul-11-24 | |
| Add new links | Nisha | Mar-18-25 |
Read Next![]()
- MCX Trading: What is it? MCX Meaning, Features & More
- Top 10 Intraday Trading Strategies & Tips for Beginners
- How to Use Pivot Points in Intraday Trading?
- What is Intraday Trading?
- Understanding Intraday Trading Timings
- How to Choose Stocks for Intraday the Right Way?
- Blending Candlestick Patterns: How It Works, Benefits & Drawbacks
- Market Order Vs Limit Order: What’s the Difference?
- Silver Futures Trading – Meaning, Benefits and Risks
- What is Crude Oil Trading and How Does it Work?
- Top Algorithmic Trading Strategies of 2025
- What is Paper Gold? – Meaning, Types, & Benefits
- What is Algo Trading?
- What is Tick Trading? Meaning & How Does it Work?
- Rising Window Candlestick Pattern
- Black Candle Pattern
- Piercing Pattern
- High-Wave Candlestick Chart Pattern
- Closing Black Marubozu Candle
- What is the Best Time Frame for Swing Trading?

- Blog
- trading
- chart patterns
- falling wedge
Falling Wedge Pattern: Meaning & Trading Features
|
|
The decision to start trading can be daunting because of the complexity of identifying chart patterns. One needs to master the chart patterns to identify trading opportunities. What if I were to tell you that a single chart pattern exists with an extremely high success rate?
In this blog, we will discuss one such pattern, the falling wedge, its features and types, and how to trade the falling wedge pattern.
What is a Falling Wedge?
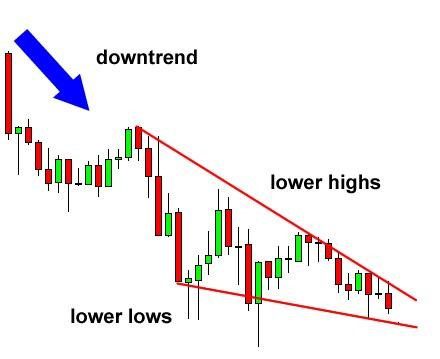
A falling wedge pattern features two trend lines drawn across the stock price’s lower highs and lower lows to form a “wedge” shape, as shown in the image below. A falling wedge is used to predict a potential reversal in a downtrend. This pattern indicates that stock prices are about to increase after the breakout.
Features of Falling Wedge Pattern
5 key features of the falling wedge pattern are listed below:
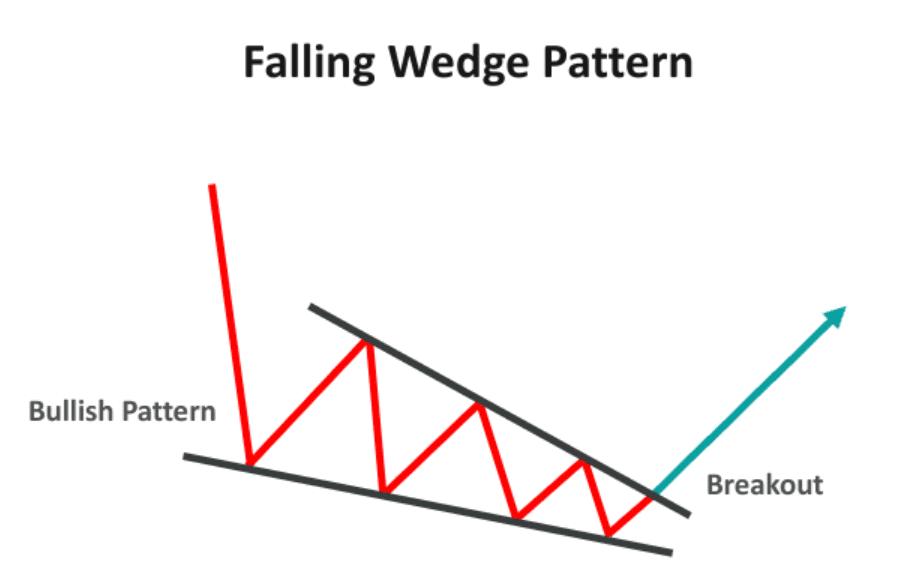
- Downward sloping trend lines: There must be two downward trending lines with the upper line steeper than the below trend line, touching consecutive lower high levels and lower low levels, converging towards each other.
- The Angle of convergence: The highs of candlesticks decline faster than the lows of the candlesticks, making a downward convergence angle of two trend lines.
- Volume: As the wedge tightens or the two trend lines converge, the volume decreases, which indicates sellers are getting weak.
- Timeframe: This pattern can be formed over various timeframes, for instance, hourly, weekly, monthly, etc. A falling wedge’s time frame doesn’t affect its validity; however, it’s observed that it is more reliable in a more extended time frame.
- Breakout: The breakout occurs above the upper trend line. If the volume increases along with the breakout, we get a confirmation of a bullish trend.
How to identify and Trade Falling Wedge Pattern
Now that we have understood the basics of falling wedge patterns, we will discuss the steps listed below used to identify and trade the falling wedge pattern.
Step 1: First, the trader needs to identify the downtrend in the chart. Look for a pattern of lower highs and lower lows in the chart. Now, you can plot two lines connecting these lower highs and lower lows.
Step 2: The second thing you need to see is if these two lines converge as the stock prices continue to move. This is the initial structure of a falling wedge.
Step 3: Analyze the volume date as the pattern forms. You will observe that the volume slowly decreases.
Step 4: Once the pattern is confirmed, wait for the price to break out of the upper trend line. After the breakout, the volume increases, confirming this as a bullish signal.
Step 5: You can enter the trade at the breakout point and place a stop-loss order just below the low price of a recent candle or according to your risk-taking ability.
Step 6: The height of the widest part of the wedge should be added to the breakout point to get your target price for exiting a trade. A trader can also consider the next resistance level as the target price.
Falling Wedge Pattern Example
Let’s understand how to take a trade using a falling wedge with the help of a practical example. In this example, we will discuss placing a stop-loss order and exit trade if you are trading using a falling wedge pattern.
Below is the chart of Bharat Electronics for a 1-hour time frame. The chart below shows the upper and lower trend lines in the falling wedge, which can also be viewed as resistance and support lines.
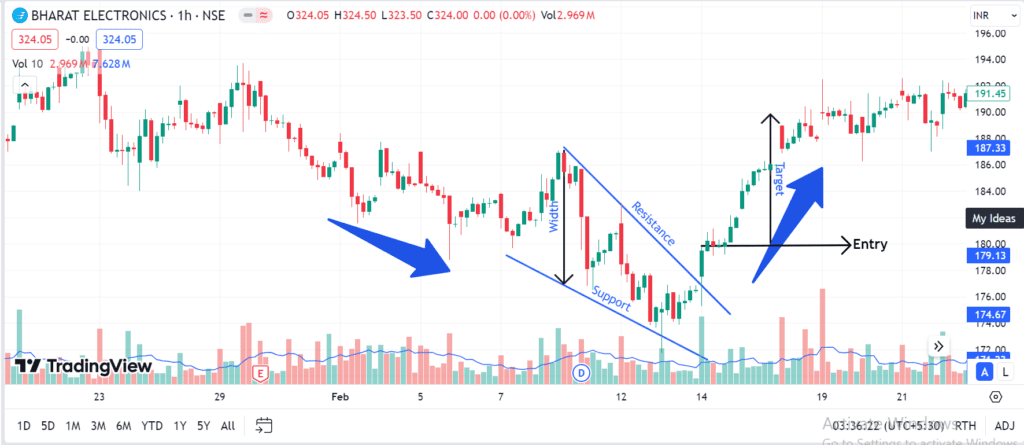
In this example, we observe that the stock prices formed a falling wedge pattern, which was followed by a breakout above the upper trendline and hit the target price.
Key areas to focus on are:
1. Trading Strategy
- Price Action: Traders must only take positions after the formation of the pattern. Entering a trade without volume confirmation can result in false breakouts.
- Risk Management: Risk management lies in being careful when placing your stop loss and setting real targets; this way, you would have mastered risk management while trading using the falling wedge and increasing the chances of making profitable trades.
2. Stop Loss
- Below the candle: Stop-loss can be below the previous candle’s low made before the breakout.
- Trailing Stop Loss: It is advised to modify stop-loss levels upwards using the trailing stop-loss technique. As the price breaks new resistance levels, trailing stop-loss orders can be used to lock in profits.
- Support zone: The alternative way to place your stop-loss is at the support levels from where the prices bounced back.
3. Target Price
- Height of the Wedge: In the above example, the target price was the width of the wedge added to the breakout point.
- Resistance Level: These are levels a stock price reaches but fails to exceed. These levels can be potential targets.
- Breakout Confirmation: If the price breaks through a level of resistance, it indicates an up-trend continuation, making the next level of resistance the next target.
Types of Falling Wedge Patterns
| Bullish Reversal | Bullish Continuation |
|---|---|
| When we have a downtrend before the actual pattern, we call it a reversal pattern. | When we have an uptrend before the actual pattern, we call it a continuation pattern. |
Read Also: Rising Wedge Chart Pattern
Benefits of Falling Wedge Pattern
The falling wedge pattern has the following benefits:
- Easy to use: This pattern has a unique shape featuring two downward converging trend lines and a price breakout, which makes it easy to identify and create a trading strategy.
- Applicability: Falling wedges are versatile because the chart pattern can be identified in several time frames. This allows flexibility for traders to apply the pattern effectively with various trading styles.
- High Reward-to-risk ratio: A falling wedge presents a high reward-to-risk if a trader takes a trade with a well-defined entry and exit strategy.
- Confirmation: A breakout of the upper trend line and the volume increase together confirms a bullish signal.
- High success rate: The falling wedge has a very high success rate in predicting bullish reversal compared to other chart patterns. That is what makes this indicator unique and popular among traders.
Read Also: Best Options Trading Chart Patterns
Conclusion
The falling wedge chart pattern is one of the most accurate chart patterns that a trader can use to predict a bullish trend. This chart pattern is easy to understand, with a high potential for the identification of trend reversal.
We discussed its features and benefits, as well as how to identify and trade to enhance your trading strategy and increase your chances of success. But remember, no trading strategy is 100% accurate. It is always advisable to consult your financial advisor before making trading decisions.
Frequently Asked Questions (FAQs)
How long does the falling wedge pattern typically last?
The falling wedge may span across several weeks to even months. Duration depends on various market conditions and the financial asset for which it is used.
How is a falling wedge different from a rising wedge pattern?
The falling wedge pattern trends downside and is a probable indication of a bullish reversal. In contrast, the rising wedge patterns trend upside and is a probable sign of a bearish reversal.
How accurate is the falling wedge?
The falling wedge pattern is considered relatively reliable and has a high success rate when it comes to the prediction of bullish reversals. Like all technical patterns, it’s not 100 % accurate and should be combined with other indicators for confirmation.
How do you identify or differentiate a falling wedge from a channel pattern?
The falling wedge pattern is where these trend lines converge and point downwards. In the case of a channel pattern, the trend lines are parallel and can point up, down, or sideways.
How to calculate the target price of the falling wedge pattern?
The target price can be calculated by adding the height of the wedge to the breakout point. Resistance levels can also be used as a target price.
Disclaimer
The securities, funds, and strategies discussed in this blog are provided for informational purposes only. They do not represent endorsements or recommendations. Investors should conduct their own research and seek professional advice before making any investment decisions.