
| Type | Description | Contributor | Date |
|---|---|---|---|
| Post created | Pocketful Team | Jun-24-24 | |
| Add new links | Nisha | Mar-18-25 |
Read Next![]()
- MCX Trading: What is it? MCX Meaning, Features & More
- Top 10 Intraday Trading Strategies & Tips for Beginners
- How to Use Pivot Points in Intraday Trading?
- What is Intraday Trading?
- Understanding Intraday Trading Timings
- How to Choose Stocks for Intraday the Right Way?
- Blending Candlestick Patterns: How It Works, Benefits & Drawbacks
- Market Order Vs Limit Order: What’s the Difference?
- Silver Futures Trading – Meaning, Benefits and Risks
- What is Crude Oil Trading and How Does it Work?
- Top Algorithmic Trading Strategies of 2025
- What is Paper Gold? – Meaning, Types, & Benefits
- What is Algo Trading?
- What is Tick Trading? Meaning & How Does it Work?
- Rising Window Candlestick Pattern
- Black Candle Pattern
- Piercing Pattern
- High-Wave Candlestick Chart Pattern
- Closing Black Marubozu Candle
- What is the Best Time Frame for Swing Trading?

- Blog
- trading
- chart patterns
- flag and pole
What is the Flag and Pole Pattern?
|
|

There are plenty of technical patterns in the stock market, but it can be challenging for traders to recognize a trustworthy chart pattern that can help them make the best decisions and increase their profits.
To make things easier, we will introduce the “Flag and Pole Pattern” to you in this blog.
Flag and Pole Pattern
The Flag and Pole pattern is a technical analysis pattern traders use to determine a stock’s trend. In general, this pattern resembles a flag flying from a pole. It denotes a notable shift in price in the pole phase followed by a consolidation phase forming a shape similar to a flag.
Features of Flag and Pole Pattern

The essential features of the flag and pole pattern are as follows-
- The continuation pattern indicates a price movement in the direction of the one shown in the pole phase, whether upside or downside.
- There will be a consolidation phase in the pattern observed in the flag part.
- Traders generally use it for short-term trading.
- This pattern provides you with valuable insight into market behaviors.
Read Also: What Is the Pennant Chart Pattern?
Pattern Formation by the Flag and Pole
There are majorly four qualities of the pattern formed by this technical analysis tool:
- Prior Trend – The term “prior trend” describes a stage in which the security price exhibits a sudden movement before the consolidation period. It represents the initial stages of development of a flag and pole pattern.
- Consolidation Phase – This chart pattern phase functions as a flag segment within the flag and pole pattern. It occurs following the stock price’s initial directional change.
- Volume Shift—This pattern simultaneously witnesses an increase in volume at first, followed by a slight fall in volume in the flag phase, and then a significant jump in stock volume once the price breaks out of the consolidation period.
- Breakout – Breakout is the pattern’s last section. It is possible to observe the breakout in either an upward or downward direction in bullish and bearish pole phases, respectively.
Types of Flag and Pole Patterns
There are two types of flag and pole pattern-
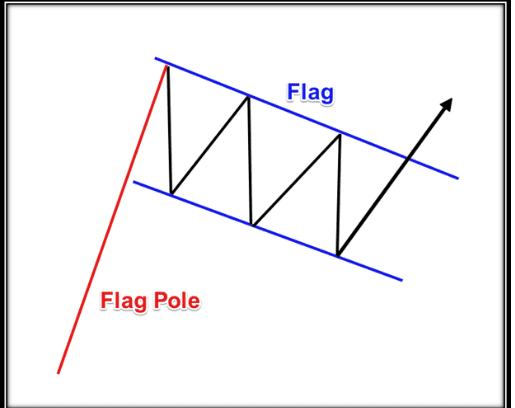
A. Bullish Flag
This pattern, sometimes called an aggressive flag and pole pattern, sees a rise in stock prices during the initial phase before entering the consolidation phase. A bullish flag pattern is formed when there is an upside breakout within the flag followed by a consolidation phase followed by a breakout above the upper trendline of the flag and rising further.
Bullish Flag and Pole Pattern Image
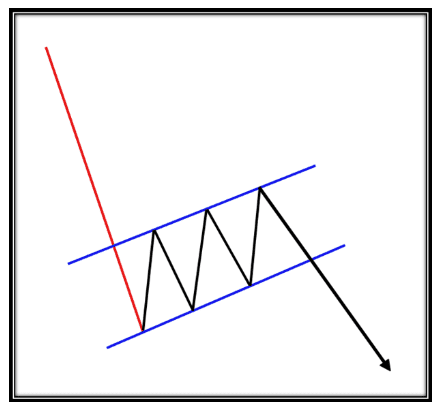
B. Bearish Flag
This happens following a downward price movement and consolidation. The price typically increases during the consolidation phase and forms an upward-sloping channel. The security’s price forms a bearish flag pattern before breaking the support level and heading lower.
Bearish Flag and Pole Pattern Image
Precautions Taken by Traders
Traders can utilize the flag and pole pattern after carefully examining the following facts:
- To trade, one must be patient and wait for the pattern to finish. By doing this, the trader guarantees that the stock has completed the consolidation phase and is prepared for a breakout.
- The investor should monitor the stock’s volume throughout the pattern; a drop in volume indicates a pattern weakness, while an increase in volume during the breakout confirms pattern completion.
- Investors should evaluate the market’s overall state before trading. Any breakout may be misleading if the market does not support the trend.
- A trader should review the support and resistance levels before the transaction.
- Since these patterns are only beneficial in short-term trades, a proper stop loss should be established near the support level for the bullish flag and resistance level for the bearish flag, and regular profit booking should also be carried out.
Read Also: What Is Head And Shoulders Pattern?
How to Identify the Flag and Pole Pattern?

A flag pattern can be affirmed using a stock’s volume. In a bull flag, volume is often highest during the first part of the upswing, declines as the market consolidates and rises again when the breakout happens. Usually, these patterns develop during a protracted upward trend. The lack of volume increases the probability that the trend will resume, which indicates that the retracement is less strong than the first gain. The stock price might not retreat during the consolidation phase but instead stay flat. To validate a flag chart pattern, wait for the original trend to reappear before initiating your position.
What Is the Target for the Flag and Pole Pattern?
The height of the pattern’s pole is often measured and added to the pattern’s breakout point to determine the target for the flag and pole pattern. But before making any trades based on this pattern, one should think about a stop loss.
Read Also: Best Options Trading Chart Patterns
Conclusion
The flag and pole pattern is considered one of the most dependable tools in technical analysis. It is appropriate for traders to determine whether the stock price continues in a possible trend or not. However, even after correctly recognizing the pattern, trading profits are not a certainty. For this reason, as a trader, one must always have a stop loss on all transactions and combine this pattern with other patterns to reinforce the logic behind the trading decision.
Frequently Asked Questions (FAQs)
How can I identify the pole in the flag and pole pattern?
A flag and pole pattern’s pole can be distinguished by its vertical price movement, which often denotes a brief price increase or fall followed by a consolidation phase.
How can a trader choose to invest based on flag and pole pattern?
When the breakout from the flag phase happens, a trader can enter the transaction. Additionally, one should set a stop loss at the flag’s low (high) when the trend is upward (downward).
What are the different types of flag and pole patterns?
There are two types of flag and pole patterns: one is bearish, and the second one is bullish.
As a trader, can I rely on flag and pole patterns?
This pattern is considered dependable when the trader waits for the completion of the pattern and has a suitable stop loss in place.
How long does a flag and pole pattern continue?
The pattern typically lasts for no more than two to three weeks.
Disclaimer
The securities, funds, and strategies discussed in this blog are provided for informational purposes only. They do not represent endorsements or recommendations. Investors should conduct their own research and seek professional advice before making any investment decisions.