| Type | Description | Contributor | Date |
|---|---|---|---|
| Post created | Pocketful Team | Jul-01-24 | |
| Add new links | Nisha | Mar-18-25 |
Read Next![]()
- Formulas used to Calculate Profit and Loss in Nifty Options
- How to Trade Fake Breakouts Using Options: 5 False Breakout Strategies
- Trade Breakouts with Options Without Overpaying IV
- How to Use MTF in the Stock Market?
- Understanding Bull Put Spread Option Strategy
- NSE Extends F&O Trading Hours by 10 Minutes
- Expiry Day Trading Explained
- High Premium Selling: Risk vs Reward Explained
- Delta Neutral Trading Strategy: What it is & How it works
- Selling Penny Options: Small Gains, Massive Risk
- Hard vs Soft Commodities: Key Differences
- How to Become a Systematic Trader: Beginner’s Guide
- 5-Minute ORB System for Option Scalping
- What is Automated Trading?
- Weekly vs Monthly Expiry in Options Trading: Key Differences
- Opening Range Breakout (ORB) Strategy
- Understanding the Equity Trade Life Cycle
- Bull Call Spread vs Bear Put Spread: Key Differences
- How to Find Stocks for Swing Trading?
- Best Exit Strategies for Day Traders
What Is Head And Shoulders Pattern In Stock Trading?
Published on : 1st July 2024
|Updated on : 20th March 2025
The Head & Shoulders pattern is one of the best patterns in technical analysis, which gives higher statistical accuracy. A higher accuracy results in consistent profitability. Want to master the Head & Shoulders Pattern? Let’s dig deeper.
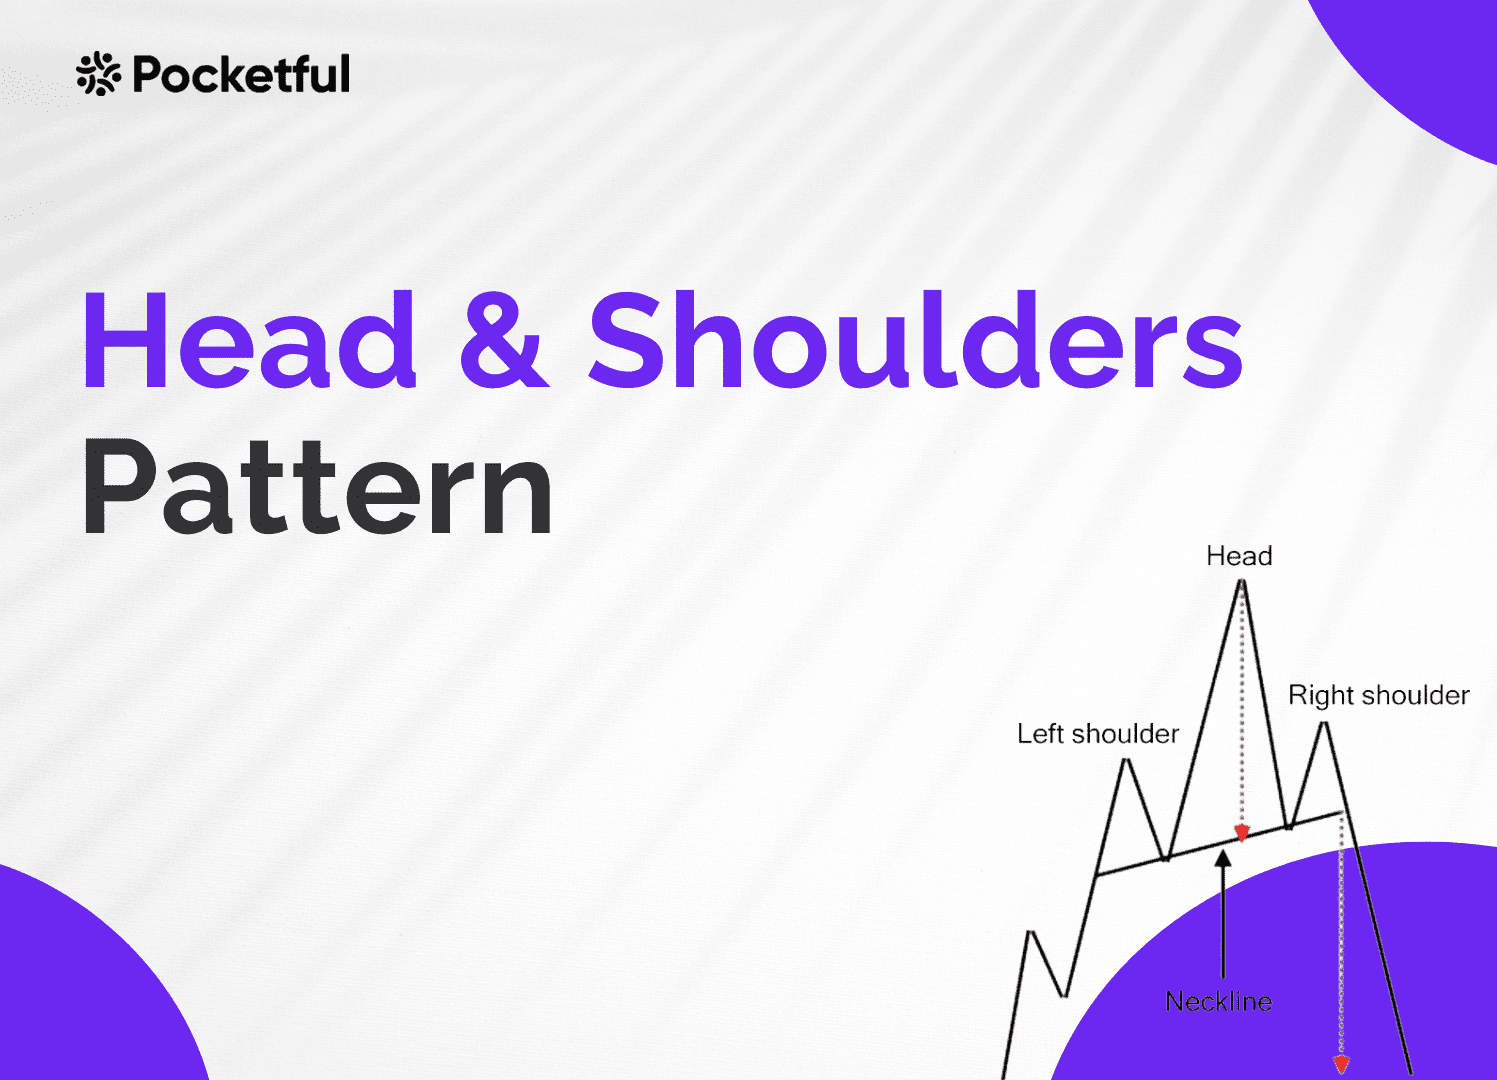
The Head & Shoulders pattern appears on a chart as three peaks. One peak in the middle is slightly higher than the two peaks on either side. These three peaks form a “Head” and two “Shoulders”, one on the left and one on the right. The Inverse Head & Shoulders pattern features one big trough in the middle, slightly lower than the two troughs on either side. These chart patterns can be useful indicators of a major trend reversal but are among the easiest to misread.
The pattern can also have more than one left or right shoulder or head, known as a Multiple Head and Shoulders pattern. One type of complex pattern is called a Wyckoff distribution, which usually has a head with two left shoulders and a weaker right shoulder.
How to Identify Head and Shoulder Pattern?
To detect a head and shoulders pattern, first understand how they’re created:
- The left shoulder forms when there is temporary buying momentum.
- The head forms when enthusiasm peaks and then declines to a point near the stock’s previous low.
- The right shoulder forms as the stock price rallies again but fails to reach its previous high before falling again.
- The neckline is formed by drawing a line underneath the points established before and after the head. When the stock’s price dips below the neckline, it’s usually a strong indication that the pattern has been broken, and it may be time to sell a position or create a short position.
Read Also: Falling Wedge Pattern: Meaning & Trading Features
Types of Head & Shoulders Pattern
There are two types of Head & Shoulders patterns. The first one is classic, where if the neckline is broken, we can get a sell target, and the second one is Inverse Head & Shoulders, which confirms the downtrend is over and the starting of an uptrend when a breakout above the neckline occurs.
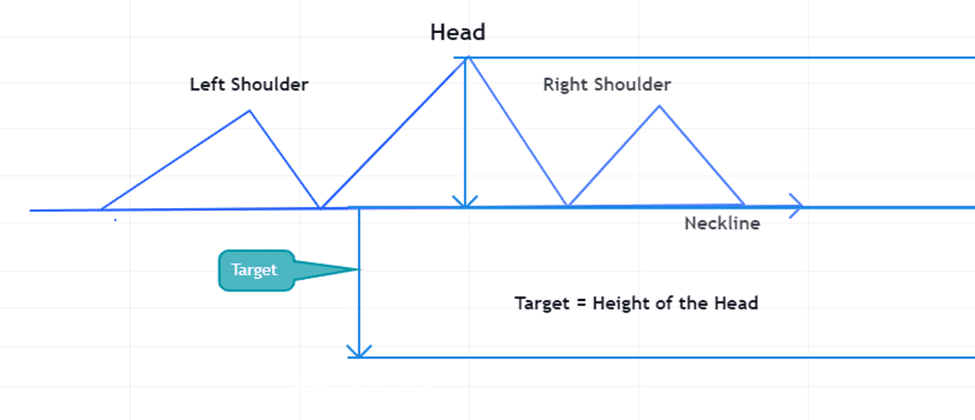
- Head & Shoulders Pattern: This happens when prices cannot surpass the previous swing high (the head) and form a lower high (the right shoulder). Once the neckline is broken, a sell signal is triggered with a target similar to the height of the head.
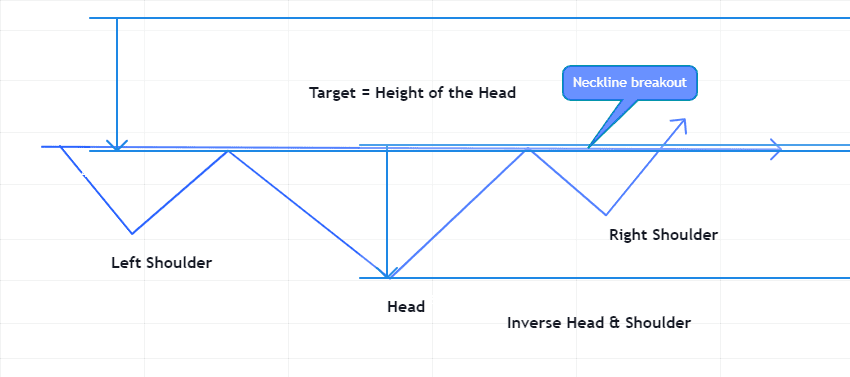
- Inverse Head & Shoulders Pattern: This happens when prices cannot surpass the previous swing low (the head) and form the higher low (the right shoulder) instead. Once the neckline is broken, a buy signal is triggered with a target similar to the height of the head.
Confirmation Metric for Head & Shoulders Pattern
Even when the stock price breaches the neckline, the trader needs confirmation of the trend. Two factors must be considered to confirm the trend:
- Volume: With a Head & Shoulders pattern, you’ll typically see trading volume drop as the price moves toward the head and then again when it rebounds to form the right shoulder, indicating declining investor enthusiasm. A spike in volume when the price moves below the neckline suggests selling pressure will continue to build. If neither of these volume signals is in play, the decline may be short-lived, though there are no guarantees.
- Time frame: The uptrend heading into the pattern should be at least twice as long as the distance between the shoulders. This confirms that any trend reversal will be significant enough to trade.
Stop Loss & Target
Stop Loss: Stop loss should be just above the right shoulder.
Target: The target should be calculated following the below steps:
- Measure the vertical between the head and the neckline.
- Identify the breakout point where the price first breaks the neckline after the right shoulder formation and add that distance to the breakout price.
Advantages of Head and Shoulders Pattern
- Easy to understand.
- It works in any market, e.g., equity, currency, or commodity markets.
- It works in any time frame; a bigger time frame means a strong trend reversal is expected.
- This pattern provides a complete setup for stop loss and target.
- Various studies show this pattern gives an 80-85% accuracy.
Disadvantages of Head and Shoulders Pattern
- Identification of patterns can be subjective, and sometimes complex patterns with multiple tops or bottoms appear, which are far from the ideal pattern.
- The shape of the pattern could be different from the bookish ideal pattern.
Example: 1
Head & Shoulders example of Bajaj Finance Ltd.
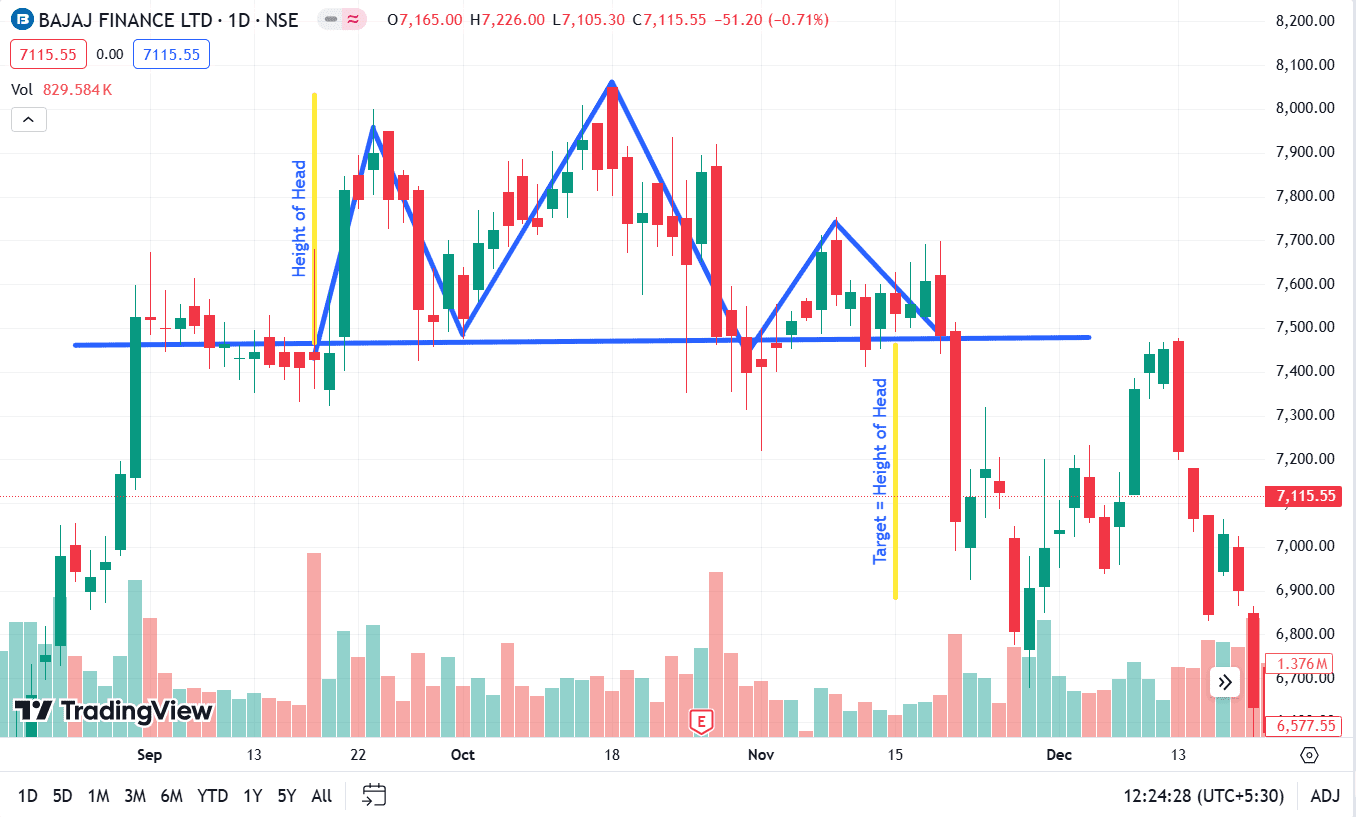
The above image features a daily chart of Bajaj Finance Ltd. It made a peak of the left shoulder on the daily chart on 23 September 2021 and completed the Head & Shoulders pattern on 18 November 2021. It fell below the neckline on 22 November 2021 and started trending downwards.
Example: 2
Inverse Head & Shoulders example of Antony Waste HDG Cell Ltd :
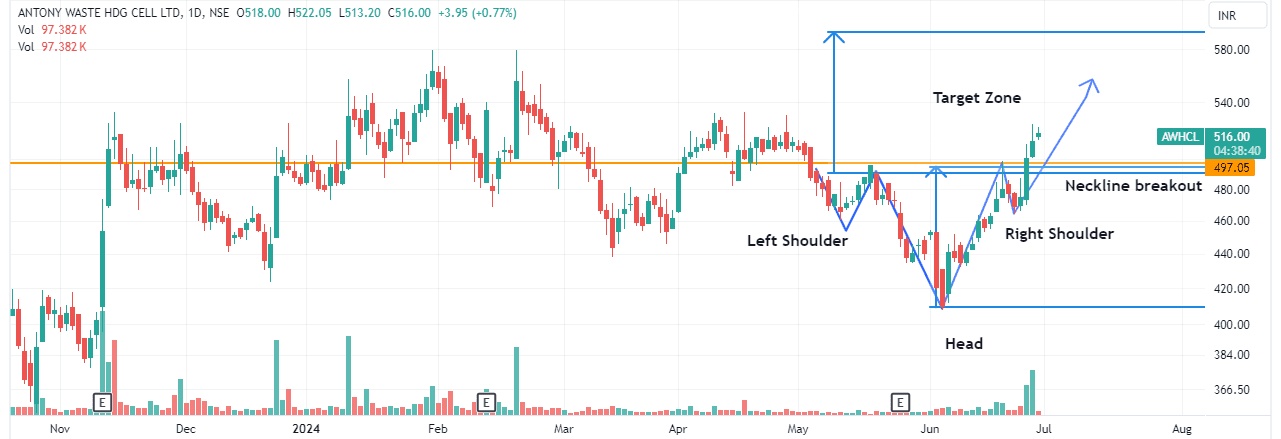
The above image features a daily chart of Antony Waste; the stock was in a downturn for some time, and then an Inverse Head & Shoulders pattern was made. The stock bounced back and broke the neckline. In this pattern, the target zone is marked as the length of the head. Stop loss should be just below the right shoulder bottom.
Read Also: Measured Move – Bullish Chart Pattern
Conclusion
Technical analysts use the Head and Shoulders pattern due to their reliability. The Head & Shoulders pattern appears with three peaks; the outside two are similar in height, and the middle is the highest peak. The Inverse Head & Shoulders pattern appears with three troughs; the outside two are similar in height, and the middle is the lowest through. The peaks or troughs on each end are called the left and right shoulders and the one in the middle is called the head. It is a trend reversal pattern, and if identified on time, it can give a great success rate.
Frequently Asked Questions (FAQs)
01
In which market does this pattern work?
It works in any market on any timeframe.
02
What is the success rate of a Head and Shoulders pattern?
The Head and Shoulders pattern is quite accurate, with a success rate of 80-85%.
03
Is the Inverse Head and Shoulders bullish signal?
It appears in the downturn and generates a bullish signal once the price goes above the neckline.
04
Is it easy to identify the Head and Shoulders pattern?
Yes, it is easy to identify as there are three peaks, and a line connecting them is called a neckline; once the neckline is broken, it is a sign to initiate a short position.
Disclaimer
The information shared in this content is intended solely for educational and informational purposes and should not be considered financial, investment, or trading advice. Any references to stocks, mutual funds, or market instruments are purely for informational purposes and do not constitute recommendations. Investments in financial markets are subject to market risks, and past performance is not indicative of future returns. Readers are advised to conduct independent research, review official documents carefully, and consult a qualified financial advisor before making any investment or trading decisions.