
| Type | Description | Contributor | Date |
|---|---|---|---|
| Post created | Pocketful Team | Sep-20-24 | |
| Add new links | Nisha | Mar-18-25 |
Read Next![]()
- MCX Trading: What is it? MCX Meaning, Features & More
- Top 10 Intraday Trading Strategies & Tips for Beginners
- How to Use Pivot Points in Intraday Trading?
- What is Intraday Trading?
- Understanding Intraday Trading Timings
- How to Choose Stocks for Intraday the Right Way?
- Blending Candlestick Patterns: How It Works, Benefits & Drawbacks
- Market Order Vs Limit Order: What’s the Difference?
- Silver Futures Trading – Meaning, Benefits and Risks
- What is Crude Oil Trading and How Does it Work?
- Top Algorithmic Trading Strategies of 2025
- What is Paper Gold? – Meaning, Types, & Benefits
- What is Algo Trading?
- What is Tick Trading? Meaning & How Does it Work?
- Rising Window Candlestick Pattern
- Black Candle Pattern
- Piercing Pattern
- High-Wave Candlestick Chart Pattern
- Closing Black Marubozu Candle
- What is the Best Time Frame for Swing Trading?

- Blog
- trading
- chart patterns
- measured move bullish continuation
Measured Move – Bullish Chart Pattern
|
|
Technical analysis features a variety of chart patterns and other tools. Knowing these chart patterns can help an investor or trader predict an upcoming trend and earn substantial profits. You can also predict the market trends if you know about one such pattern known as the Measured Move Bullish chart pattern.
In today’s blog, we will explore the Measured Move Bullish chart pattern, its interpretation, advantages, and limitations.
What is the Measured Move Bullish Chart Pattern?
The Measured Move Bullish chart pattern predicts a possible price increase or a bullish trend. Initially, the stock price appreciates significantly and then enters a consolidation phase or exhibits sideways movement, forming the pattern. It is considered complete once the price gives a breakout above the highest point of the consolidation phase.
To recognize a Measured Move Bullish chart pattern, traders generally look for two swing highs, followed by a minor price correction that retraces a specific percentage of the initial price move. The initial uptrend is followed by a consolidation phase in the shape of a rectangle or a descending triangle. Once these criteria are met, a target level can be projected using the measured move technique.
Interpretation
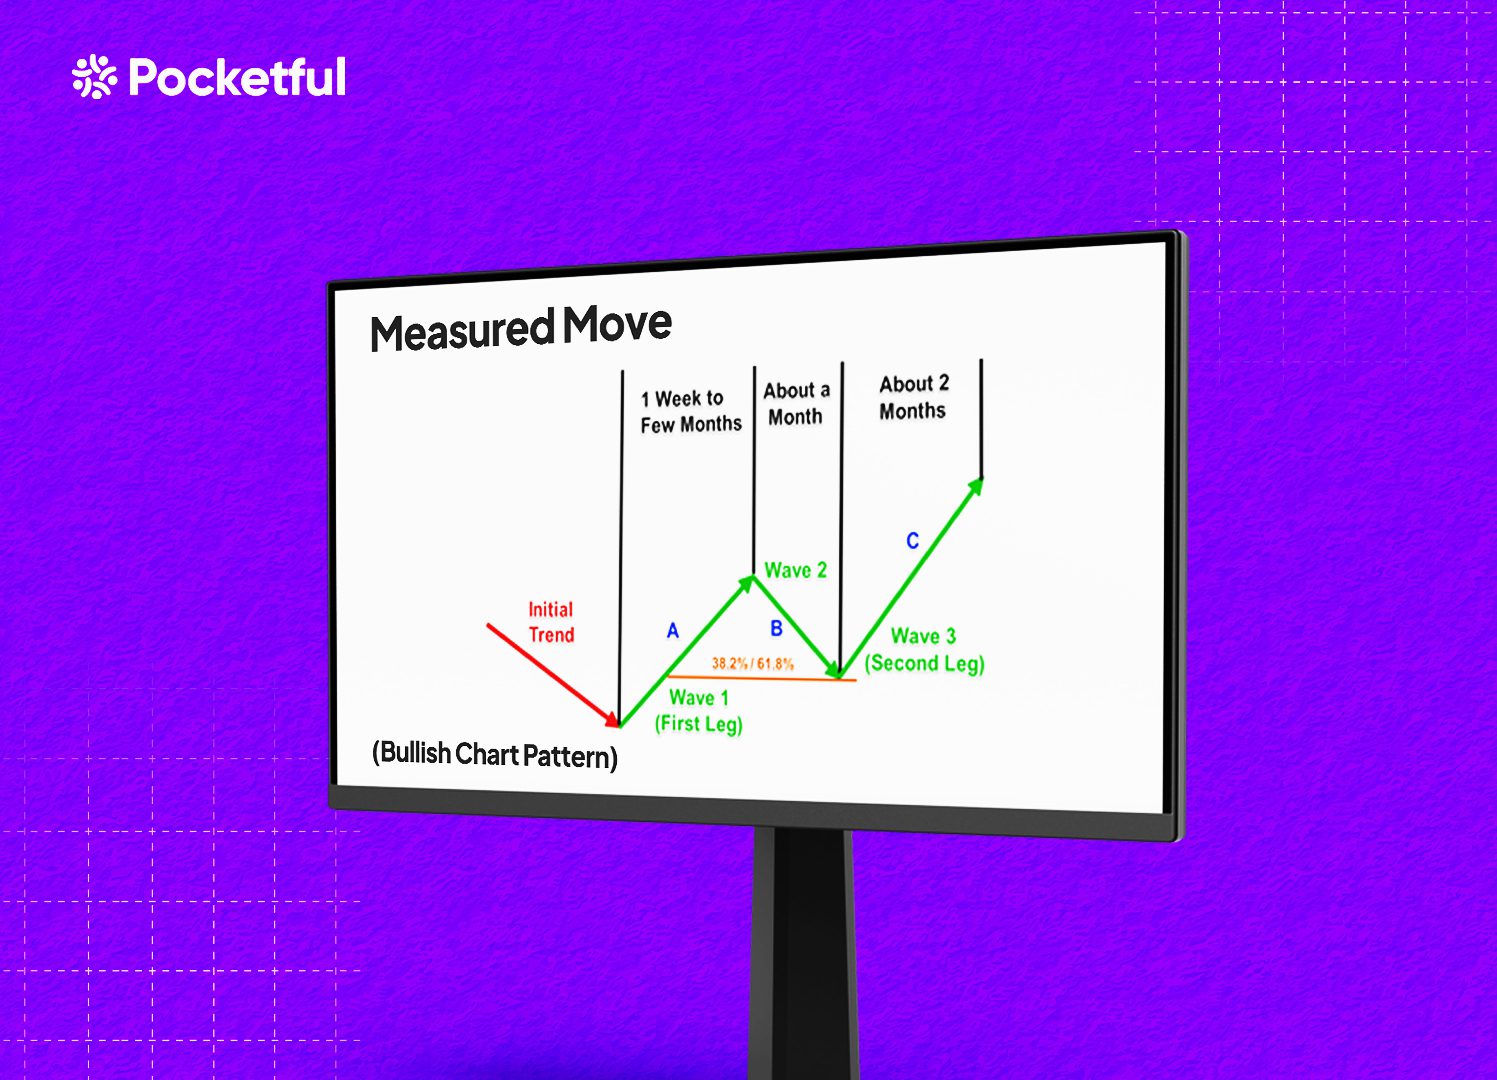
The pattern predicts future price movements based on previous price actions. The pattern consists of three phases, which suggest the continuation of a trend. The summary of the three phases is mentioned below:
- Initial Move – The initial phase of the pattern consists of an upward price movement.
- Correction or Consolidation – After the initial uptrend, the price goes through a period of correction or consolidation, moving sideways or slightly against the initial trend.
- Measure Move – It is the expected distance the trend will continue after the breakout from the consolidation phase. It is calculated by measuring the distance of the initial move and projecting it from the breakout point of the correction or consolidation phase. Some traders consider the initial move in percentage terms and use it to calculate the target price.
How to Determine Target and Stop-Loss?
The target price can be determined by calculating the length of the initial upward movement from the point of breakout in absolute terms or percentage terms. For instance, if the initial uptrend was a 10% increase, the target would be 10% above the breakout point.
For a bullish measured move, the stop loss can be placed just below the low point of the consolidation phase to protect against losses in case of a false breakout.
Example of Bullish Chart Pattern
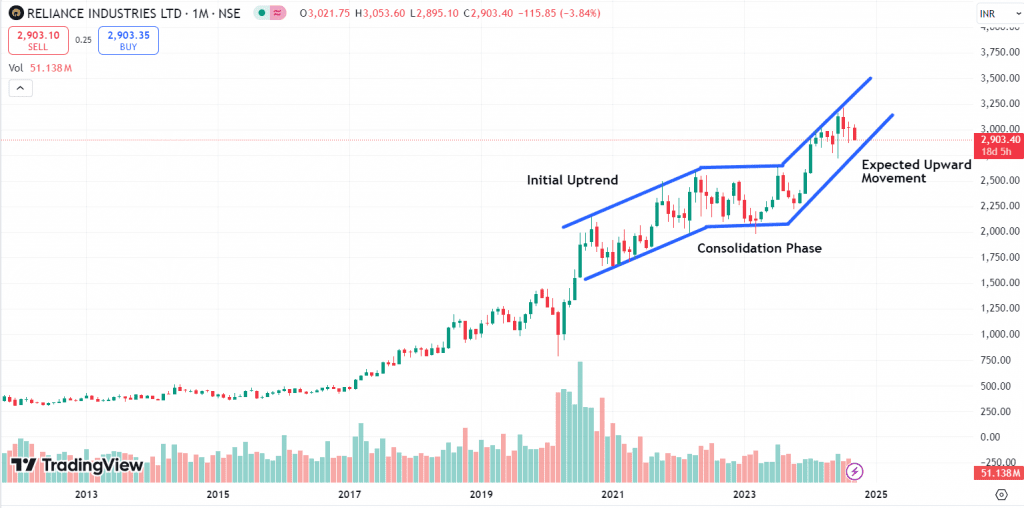
The above image shows the chart of Reliance Industries on a monthly time frame, and a clear formation of the Measured Move Bullish chart pattern can be observed. We can observe the pattern in three phases:
- The initial move was a sharp uptrend, and the stock price increased from INR 1,658 to INR 2,582.
- The consolidation phase shows a sideways price movement with a high of INR 2,630 and a low of INR 1,979.
- The measured move is the expected upward movement from the end of the consolidation phase, which is equal in distance to the initial upward trend. We see the stock price move above the consolidation phase, gave a breakout at INR 2,582, and made a high of INR 3,217.
Read Also: Measured Move – Bearish Chart Pattern
Advantages of Bullish Chart Pattern
The advantages of using the Measured Move Bullish chart pattern are:
- Clear Indication of a Trend – It offers a visually distinct representation of a bullish trend. This makes it easier for traders to recognize the ongoing trend and make better trading decisions.
- Simple – This pattern is relatively easy to use and implement, making it useful to traders of all levels.
- Objective Measurement – Traders can determine the target and stop-loss levels objectively by analyzing the components of the pattern. This helps reduce the subjective-decision making.
Limitations of Bullish Chart Pattern
The limitations of using the Measured Move Bullish chart pattern are:
- False Breakouts – Prices may temporarily breach the consolidation phase but can again enter the consolidation channel, causing a false breakout. This situation can cause losses for traders who create long positions too early.
- Confirmation Needed – Confirmation is required before entering a trade when there is a breakout after the consolidation phase. You may need to wait for a retest of the broken trendline or look at other technical indicators for more support.
- Market Conditions – Volatility, volume, overall market sentiment, etc., can affect the pattern’s effectiveness.
Read Also: Broadening Top Chart Pattern
Conclusion
Technical analysts find the measured move chart pattern to be an invaluable tool for identifying possible price movements. The pattern works well when combined with other technical indicators and increases the probability of successful trades. However, it is important to remember that no technical analysis pattern is perfect. While the measured move strategy may not always unfold as anticipated, it is crucial to analyze it carefully for a more comprehensive analysis. An investor must consult a financial advisor before investing.
Frequently Asked Questions (FAQs)
Is the Measured Move chart pattern bullish or bearish?
The Measure Move chart pattern can be either bullish or bearish, depending on the direction of the initial move.
Is the Measured Move Bullish chart pattern suitable for all timeframes?
The pattern may work better in a longer timeframe than in a short timeframe.
Can the pattern be used for different financial instruments?
The pattern can be used to predict price movements in stocks, commodities, currencies, and other financial assets.
Does the Measured Move Bullish chart pattern always give accurate predictions of future price movements?
The Measured Move Bullish chart pattern is a chart pattern that can help anticipate movements but does not assure 100% accuracy.
What is the best way to use the Measured Move Bullish chart pattern?
It is suggested that the Measured Move Bullish chart pattern be used in combination with the other technical indicators such as volume, RSI, etc.
Disclaimer
The securities, funds, and strategies discussed in this blog are provided for informational purposes only. They do not represent endorsements or recommendations. Investors should conduct their own research and seek professional advice before making any investment decisions.