
| Type | Description | Contributor | Date |
|---|---|---|---|
| Post created | Pocketful Team | Jun-24-24 | |
| Add new links | Nisha | Mar-18-25 |
Read Next![]()
- MCX Trading: What is it? MCX Meaning, Features & More
- Top 10 Intraday Trading Strategies & Tips for Beginners
- How to Use Pivot Points in Intraday Trading?
- What is Intraday Trading?
- Understanding Intraday Trading Timings
- How to Choose Stocks for Intraday the Right Way?
- Blending Candlestick Patterns: How It Works, Benefits & Drawbacks
- Market Order Vs Limit Order: What’s the Difference?
- Silver Futures Trading – Meaning, Benefits and Risks
- What is Crude Oil Trading and How Does it Work?
- Top Algorithmic Trading Strategies of 2025
- What is Paper Gold? – Meaning, Types, & Benefits
- What is Algo Trading?
- What is Tick Trading? Meaning & How Does it Work?
- Rising Window Candlestick Pattern
- Black Candle Pattern
- Piercing Pattern
- High-Wave Candlestick Chart Pattern
- Closing Black Marubozu Candle
- What is the Best Time Frame for Swing Trading?

- Blog
- trading
- chart patterns
- pennant
What Is the Pennant Chart Pattern?
|
|
Do you also feel lost in the swings of the stock market? Want to catch the next wave but need help determining when to jump in? Technical analysis can be of great use for a chartist.
Today’s blog will discuss a powerful technical tool, Pennant chart patterns.
Pennant Chart Pattern Meaning
The Pennant chart pattern is a technical analysis tool widely used by traders to identify prospective short-term continuations or reversals in the price of a security. The pattern resembles a flag with a tall pole and a triangular flag (pennant). These pennants can signal explosive stock price moves and help you recognize trends.
A rapid price movement, either up or down, is called the flagpole. A pennant is formed when converging trend lines create a consolidation period.
The consolidation suggests a temporary pause in the market before a potential continuation of the original trend. Traders often employ pennant formations to predict breakout points, which occur when the price decisively moves above or below the trendlines of the pennant.
Types of Pennants Pattern

There are two main types of pennant patterns.
- Bullish Pennant
It is formed during uptrends and suggests a continuation of the upward trend after a period of consolidation. - Bearish Pennant
It forms during a downtrend and signals a likely continuation of the downtrend after a period of consolidation.
Uses of Pennant Chart Patterns

The primary objective of pennant chart patterns is to recognize the continuation of the prevailing trend in a security’s price.
Identification of Breakout Points
After a significant price movement, the pennant showcases a period of consolidation. Traders watch for a clear break above (below) the trendline for the bullish (bearish) pennant, to indicate a continuation of the initial trend.
Estimating Price Targets
The height of the flagpole can be used to estimate the price target after the breakout. The price is expected to move by a similar amount after the consolidation period.
Furthermore, pennant patterns are used to predict short-term price movements, but they do not guarantee future price movements because the pennant shows uncertainty among buyers and sellers. Although a breakout may indicate a resolution, the price can always abruptly change direction.
Traders use pennant patterns along with other technical indicators like volume or moving averages to better understand the market and breakouts.
Advantages of Pennant Chart Pattern
- Pennant patterns are easily recognizable on charts compared to other technical indicators. This feature makes it easy for both new and experienced traders to access.
- These patterns can be helpful for traders who want to take advantage of a trend’s momentum but are still determining the precise timing for entry and exit points.
- The flagpole can provide a basis for estimating the price targets after a breakout.
Disadvantages of Pennant Chart Pattern
- Traders may interpret the tightness of the pennant’s trendlines and the definition of a breakout differently which can cause disagreements about the signal’s validity.
- Pennant’s breakouts may not always suggest a continuation of a trend. Sometimes, the price breaks through the trendline but then quickly changes direction, creating a false breakout that can confuse traders.
- Pennants may not be effective for long-term trends or significant market shifts.
- They only consider price changes and do not consider other important factors like news, economic data, and company fundamentals. Relying solely on the pennants can create a blind spot for these influences.
Read Also: Chart Patterns All Traders Should Know
Example of a Pennant
We have an example of Reliance Industries on technical charts showcasing bullish and bearish pennant patterns.
Bullish Pennant
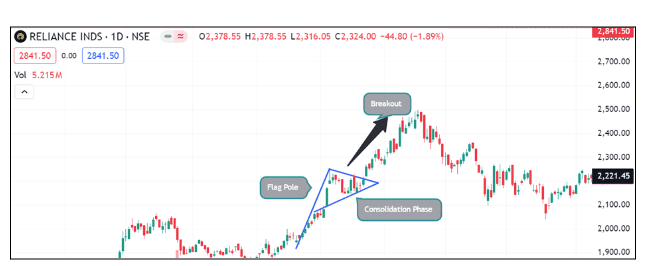
In the above image, the asset price witnessed a sharp increase. This initial upward move is the flagpole of the bullish pennant pattern.
Following the sharp rise, the price enters a consolidation phase and forms a triangle with converging trendlines, similar to a flag known as a pennant.
If the price breaks above the upper trendline of the pennant, it is usually seen as a bullish sign.
Bearish Pennant
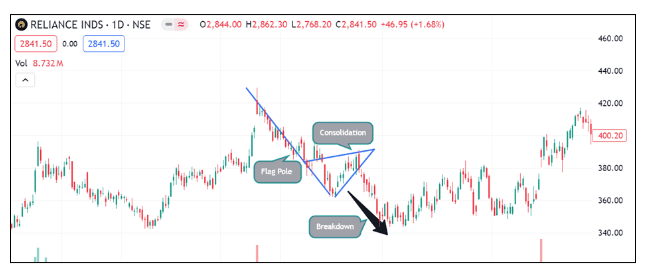
On the other hand, the asset price witnessed a sharp decline in the image above. This initial downward move is the flagpole of the pennant pattern.
Following the sharp fall, the price enters its consolidation phase and forms a triangle with converging trendlines, similar to a flag known as a pennant.
If the price breaks below the lower trendline of the pennant, it is usually seen as a bearish sign.
Read Also: Best Options Trading Chart Patterns
Conclusion
To sum it up, pennant patterns are helpful for analysts in identifying trend continuations. They are relatively simple and can estimate price targets after a breakout. However, interpretations can be subjective, prone to false signals, and have limited application in long-term forecasting abilities. Using pennants in combination with other indicators while maintaining a prudent level of scepticism enables traders to make more informed decisions to enhance their technical analysis and profits.
Frequently Asked Questions (FAQs)
What is a pennant chart pattern?
A pennant chart pattern is a technical indicator used to spot possible short-term continuations of a price trend after a period of consolidation.
Are there different types of pennants?
Yes, bullish pennants are formed during uptrends and bearish pennants are formed during downtrends.
How are price targets estimated?
The flagpole height can be a rough estimate for the price target after a breakout.
Are pennants always accurate?
No, pennants are not foolproof indicators. The market can be unpredictable, and false breakouts can occur.
Are pennants good for beginners?
Pennants can be a good starting point, but they need practice and should only be used for actual trades once you are comfortable identifying them.
Disclaimer
The securities, funds, and strategies discussed in this blog are provided for informational purposes only. They do not represent endorsements or recommendations. Investors should conduct their own research and seek professional advice before making any investment decisions.