| Type | Description | Contributor | Date |
|---|---|---|---|
| Post created | Pocketful Team | Sep-03-24 | |
| Add new links | Nisha | Mar-18-25 |
Read Next![]()
- What is Tender Period in MCX?
- Top 10 Biggest Stock Market Crashes in India
- What is Reversal Trading?
- What Is an OCO Order?
- Bankex vs Sensex: Key Differences
- How to Earn Money in Share Market?
- Difference Between Sensex and Nifty
- What Is a Brokerage Account?
- Best Stop Loss Strategies for Day Trading in 2026
- Best ETF Trading Strategies in India
- What is Overnight Trading?
- Why Option Buyers Lose Money in Trading
- Formulas used to Calculate Profit and Loss in Nifty Options
- How to Trade Fake Breakouts Using Options: 5 False Breakout Strategies
- Trade Breakouts with Options Without Overpaying IV
- How to Use MTF in the Stock Market?
- Understanding Bull Put Spread Option Strategy
- NSE Extends F&O Trading Hours by 10 Minutes
- Expiry Day Trading Explained
- High Premium Selling: Risk vs Reward Explained
Rising Wedge Chart Pattern
Published on : 3rd September 2024
|Updated on : 18th March 2025
Several trading chart patterns are available in the field of technical analysis that can make a trader profitable. To better understand a stock’s price momentum, traders typically use many chart patterns, either separately or in combination with other technical indicators.
In today’s blog, we will explain the “Rising Wedge Chart Pattern” and how it can be used.
Overview of Rising Wedge Pattern
Often referred to as an ascending wedge pattern, the rising wedge chart pattern is a technical analysis tool that occurs after a downtrend, followed by a wedge-shaped formation. Typically, this pattern appears in bearish markets. The lower trendline of this pattern has a more steep slope compared to the slope of the upper trendline, giving the appearance of an upward-sloping wedge.
Features of Rising Wedge Chart Pattern
The features of rising wedge chart patterns are mentioned below:
- This pattern is characterized by two trend lines connecting higher highs and higher lows.
- At the time of formation of the pattern, if the volume decreases, it suggests a weakening of bullish momentum.
- The breakout often occurs in the downward direction with an increase in volume.
Interpretation of Rising Wedge Chart Pattern
A bearish reversal is indicated by the rising wedge pattern, which is interpreted when the stock price crosses below the lower trend line. In addition, a thorough analysis of the volume is necessary because any drop in volume during breakout can signal a possible fake breakout. Two trend lines that slope upward and converge as they stretch generate this pattern. This pattern receives a wedge shape from this convergence of the two trendlines. Along with a decline in trading volume, the price range narrows, which suggests a possible loss of upward momentum. When all these factors are taken into consideration, there may be a possibility that the stock price will swing from rising to falling.
Read Also: Best Options Trading Chart Patterns
Trading a Rising Wedge Chart Pattern
The following points must be kept in mind when trading:
- Entry Point: When the price breaks below the lower trend line with increased volumes, a trader can create a short position in the asset.
- Stop-Loss: The highest point of the wedge or a point just above the upper trendline can be used as a stop-loss.
- Target: Measure the height of the pattern at its widest point and subtract it from the breakout point to get the target price.
A trader should use other technical tools to confirm the bearish movement.
Example of Rising Wedge Pattern
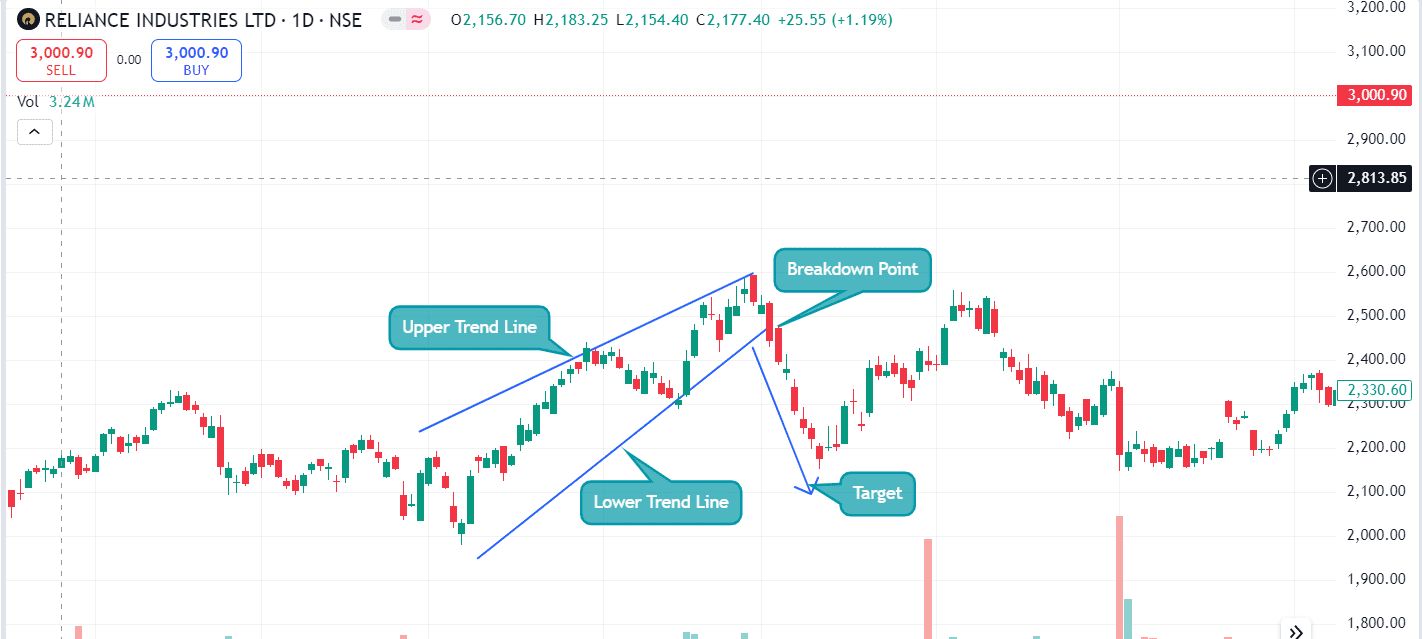
The above image shows a Rising Wedge chart pattern for Reliance Industries over a daily time frame. The chart shows two trend lines converge, and the stock price fluctuates between them. Eventually, the price breaks below the lower trend line, indicating a downward trend in the stock price. The target is determined by the pattern’s height at its widest point.
Advantages of Rising Wedge Chart Pattern
The advantages of a rising wedge pattern are as follows:
- Signal TIming – This pattern provides an early sign of trend reversal, which helps traders to enter and exit timely.
- Common Pattern – This pattern can be easily identified.
- Target and Stop loss – A rising wedge pattern has clearly defined target and stop loss levels.
Disadvantages of Rising Wedge Chart Pattern
The disadvantages of the Rising Wedge pattern are as follows-
- False signals – Sometimes, the Rising Wedge pattern gives false signals, which might cause a trader to make incorrect trade decisions.
- Confirmation – The pattern requires confirmation from other indicators, which makes this a complex pattern to use in trading.
- Market Conditions – The pattern could be affected by various market factors, such as volatility, news, policy change, political instability, etc.
Read Also: Falling Wedge Pattern: Meaning & Trading Features
Conclusion
In summary, the Rising Wedge pattern is a valuable tool in technical analysis that suggests a possible bearish reversal signal. Investors rely on this pattern because it is easy to interpret and has clearly defined entry and exit levels. This pattern can be combined with other technical tools to get confirmation and increase your chances of success. However, it is advised to consult a financial advisor before investing.
Frequently Asked Questions (FAQs)
01
Is the Rising Wedge a bullish or bearish pattern?
The Rising Wedge chart pattern is a bearish pattern.
02
Is there any difference between a Rising Wedge and a Rising Triangle pattern?
A rising triangle is a continuation pattern in technical analysis, while a rising wedge is a bearish reversal pattern.
03
Is a Rising Wedge an accurate pattern?
The Rising Wedge pattern can be quite accurate when used with other technical indicators. However, no pattern can be 100% accurate.
04
How do we calculate the stop loss level for the Rising Wedge pattern chart pattern?
A stop-loss for a rising wedge pattern can be placed just above the upper trend line, or a trader can use a trailing stop-loss to lock in profits.
05
What is the target when the Rising Wedge pattern forms?
Measuring the pattern’s height at its widest point and subtracting it from the breakout price gives us the target price.
Disclaimer
The information shared in this content is intended solely for educational and informational purposes and should not be considered financial, investment, or trading advice. Any references to stocks, mutual funds, or market instruments are purely for informational purposes and do not constitute recommendations. Investments in financial markets are subject to market risks, and past performance is not indicative of future returns. Readers are advised to conduct independent research, review official documents carefully, and consult a qualified financial advisor before making any investment or trading decisions.