
| Type | Description | Contributor | Date |
|---|---|---|---|
| Post created | Pocketful Team | Aug-28-24 | |
| Add new links | Nisha | Mar-18-25 |
Read Next![]()
- MCX Trading: What is it? MCX Meaning, Features & More
- Top 10 Intraday Trading Strategies & Tips for Beginners
- How to Use Pivot Points in Intraday Trading?
- What is Intraday Trading?
- Understanding Intraday Trading Timings
- How to Choose Stocks for Intraday the Right Way?
- Blending Candlestick Patterns: How It Works, Benefits & Drawbacks
- Market Order Vs Limit Order: What’s the Difference?
- Silver Futures Trading – Meaning, Benefits and Risks
- What is Crude Oil Trading and How Does it Work?
- Top Algorithmic Trading Strategies of 2025
- What is Paper Gold? – Meaning, Types, & Benefits
- What is Algo Trading?
- What is Tick Trading? Meaning & How Does it Work?
- Rising Window Candlestick Pattern
- Black Candle Pattern
- Piercing Pattern
- High-Wave Candlestick Chart Pattern
- Closing Black Marubozu Candle
- What is the Best Time Frame for Swing Trading?

- Blog
- trading
- chart patterns
- rounding bottom
Rounding Bottom Chart Pattern
|
|
The Rounding Bottom chart pattern, also known as the Saucer Bottom pattern, is a bullish reversal pattern. The Rounding Bottom chart pattern indicates a change of trend from bearish to bullish because it initially forms a downtrend followed by a gradual uptrend. Rounding Bottom is one of the time-consuming patterns in technical analysis, which gives higher statistical accuracy. Let’s dig deeper into it.
What is the Rounding Bottom Pattern?
The name Rounding Bottom suggests that security forms a “U” Shape or a bowl shape on a chart. In this pattern, the asset price starts to fall steadily with a gradual decrease in volume. For some time, the asset price remains in a narrow range, and no sharp fall is seen. After remaining in a sideways range, the asset price slowly increases. The Rounding Bottom is considered a bullish reversal pattern as it indicates that the selling pressure is decreasing and the buying pressure is increasing, indicating a potential change in the trend direction.
How to Identify the Rounding Bottom Chart Pattern?
Look for the following characteristics to identify the Rounding Bottom chart pattern:
- Downtrend: Before the pattern forms, the asset price shows a downtrend.
- Gradual Decline: Price declines gradually with a slight curve-shaped formation on the chart.
- Rounded Bottom: The price forms a rounded bottom that indicates the accumulation stage for the security. Investors accumulate security in this stage.
- Increasing Volume: Price starts rising with an increase in volume, giving a clear indication of buying momentum.
- Breakout: The breakout happens when an asset price breaks the previous high or resistance level, confirming the trend reversal.
Trading Setup
The Rounding Bottom pattern can be used to develop a trading setup, as shown below. However, trading based on chart patterns can be extremely complex, and investors must consult a financial advisor before investing. A Rounding Bottom chart pattern can be used in determining the following:
- Entry Point: An entry point can be determined near the levels where the asset price breaks the resistance levels. Here, the resistance level is the same level from where the stock started falling. Investors can also use volume analysis to get confirmation.
- Stop Loss: A stop loss should be placed ideally below the lowest point of the rounding bottom pattern to manage risk and limit losses.
- Target: Measure the vertical distance from the bottom of the rounding pattern to the resistance level. Find the breakout point where the price first breaks the resistance and add that distance to the breakout price.
Trading Strategies
Here are a few trading strategies based on rounding bottom chart pattern:
- Buy on breakout: Buy the security when the price first moves above the resistance level, confirming the trend reversal.
- Buy on pullback: If you couldn’t buy at breakout, wait for a pullback to the support level, and then enter the trade.
- Set stop-loss: Set a stop-loss below the lowest level of rounding bottom or after breakout around the nearest support level to limit potential losses.
Read Also: List of Best Swing Trading Patterns
Advantages of Rounding Bottom Pattern
Rounding Bottom chart pattern has the following advantages:
- Easy to understand and identify.
- It works in any market, such as equity markets, currency markets, commodity markets, etc.
- It works in any time frame; a bigger time frame means strong trend reversal is on the cards.
- This pattern provides information regarding stop-loss and target levels.
- The pattern allows effective risk management as it gives clear stop-loss levels.
- According to various studies, this pattern gives quite accurate results.
Limitations of Rounding Bottom Pattern
Rounding Bottom chart pattern has the following limitations:
- The signals given by the pattern can be subjective because, on numerous occasions, complex patterns with multiple lows appear that are far from the ideal pattern.
- It is a time-consuming pattern.
- It could give a false breakout signal, which can result in losses.
- This pattern could be affected by various market factors, such as volatility, news, policy change, political instability, etc.
- The shape of the pattern could be different from the bookish ideal pattern.
Example – 1
Rounding Bottom example of PTC India Ltd.
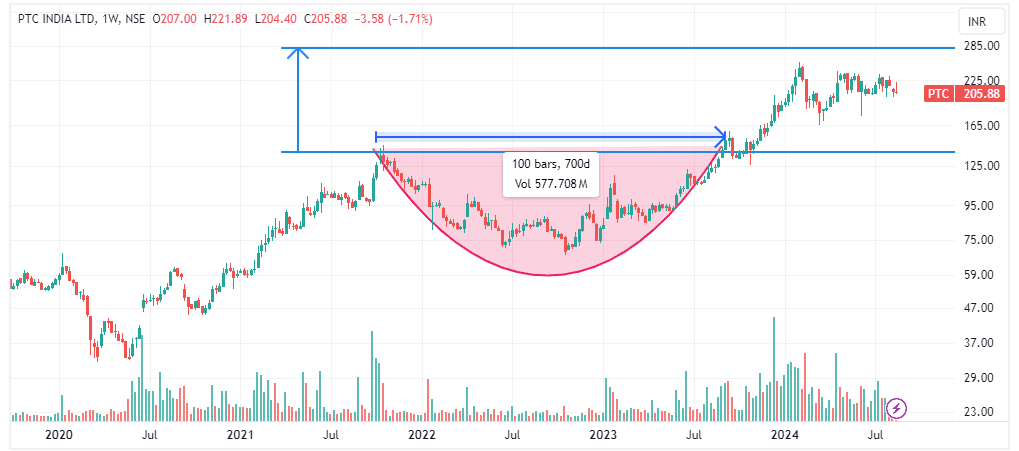
The above image shows the weekly chart of PTC India Ltd. The stock price gave a breakout with huge volumes on the weekly timeframe in November 2023. The stock started moving up and surpassed the highs of 2010, 2017, and 2021 and broke the resistance line joining these highs. In November, it broke the 2021 high of INR 140 and made a new high of INR 254, after which the stock gave sideways movements. The current market price is INR 205.
Example – 2
Running example of Deepak Fertilizers, which could be a potential Rounding Bottom chart pattern candidate.
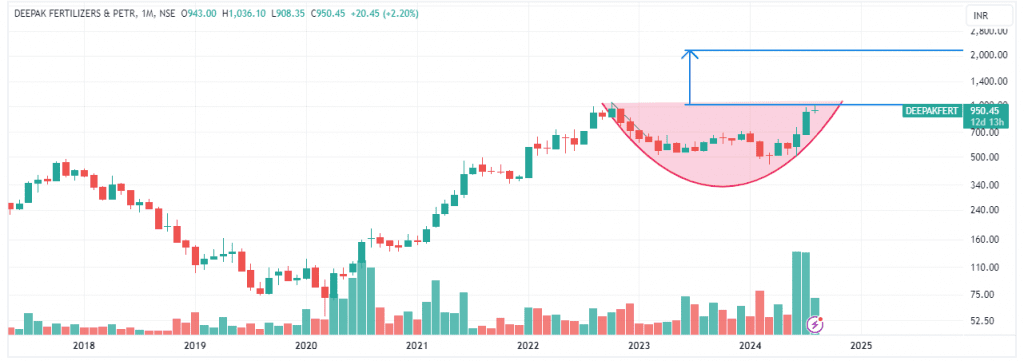
The above image shows the monthly chart of Deepak Fertilizers. The stock was in a downtrend for some time, and then it started making a Rounding Bottom chart pattern. From October 2022 to March 2024, the stock price fell from a high of INR 1062 to INR 450. The stock price started rising with big volumes and is about to break the neckline. It will be interesting to watch if it gives a breakout in the near future.
Read Also: Chart Patterns All Traders Should Know
Conclusion
The Rounding Bottom chart pattern is a very powerful technical chart pattern for investors and traders alike. It is a time-consuming pattern but has the potential to offer significant gains. It is a trend reversal pattern that indicates the potential change in the trend direction. Initially, it is characterized by a slow and steady decline in the asset price, followed by a slow and steady increase in the price in a way that forms a rounded bottom. By understanding the pattern’s characteristics, trade setup, strategies, and pros and cons, traders and investors can make informed mid to long-term investment decisions and improve their chances of success in the markets. However, it is advised to consult a financial advisor before investing.
Frequently Asked Questions (FAQs)
In which market does the Rounding Bottom chart pattern work?
The rounding bottom pattern works in any market and time frame.
What is the success rate of the Rounding Bottom chart pattern?
It depends upon the market conditions and time frames. The longer the time frame (months or years), the higher the success rate.
How is the Rounding Bottom chart pattern different from the Cup and Handle chart pattern?
Generally, the Rounding Bottom chart pattern makes a smooth, rounded U-shape pattern with no additional formations, but the Cup and Handle pattern makes another smaller formation, which is either downward or sideways consolidation.
Is it easy to identify the Rounding Bottom chart pattern?
Yes, a rounding bottom pattern can be identified easily. Investors must look for a gradual downtrend followed by a gradual uptrend. Investors can create a long position when an asset price breaks the resistance level.
How can we use the Rounding Bottom chart pattern to determine stop loss?
Stop loss can be set as the lowest price point of the rounded bottom to prevent huge losses.
Disclaimer
The securities, funds, and strategies discussed in this blog are provided for informational purposes only. They do not represent endorsements or recommendations. Investors should conduct their own research and seek professional advice before making any investment decisions.