
| Type | Description | Contributor | Date |
|---|---|---|---|
| Post created | Pocketful Team | Aug-29-24 | |
| Add new links | Nisha | Mar-18-25 |
Read Next![]()
- MCX Trading: What is it? MCX Meaning, Features & More
- Top 10 Intraday Trading Strategies & Tips for Beginners
- How to Use Pivot Points in Intraday Trading?
- What is Intraday Trading?
- Understanding Intraday Trading Timings
- How to Choose Stocks for Intraday the Right Way?
- Blending Candlestick Patterns: How It Works, Benefits & Drawbacks
- Market Order Vs Limit Order: What’s the Difference?
- Silver Futures Trading – Meaning, Benefits and Risks
- What is Crude Oil Trading and How Does it Work?
- Top Algorithmic Trading Strategies of 2025
- What is Paper Gold? – Meaning, Types, & Benefits
- What is Algo Trading?
- What is Tick Trading? Meaning & How Does it Work?
- Rising Window Candlestick Pattern
- Black Candle Pattern
- Piercing Pattern
- High-Wave Candlestick Chart Pattern
- Closing Black Marubozu Candle
- What is the Best Time Frame for Swing Trading?

- Blog
- trading
- chart patterns
- triple top reversal
Triple Top Reversal Chart Pattern
|
|

Are you looking for a reliable way to forecast market trends? The Triple Top Reversal chart pattern is here to save the day. This technique has been useful for many traders in predicting downturns in the market after an uptrend, hence giving a clear signal of creating short positions.
In this blog, we will discuss how the Triple Top Reversal chart pattern can help you make more informed trading decisions. Let’s dive deep into how it works and explain why it’s so trusted.
What is the Triple Top Reversal chart pattern?
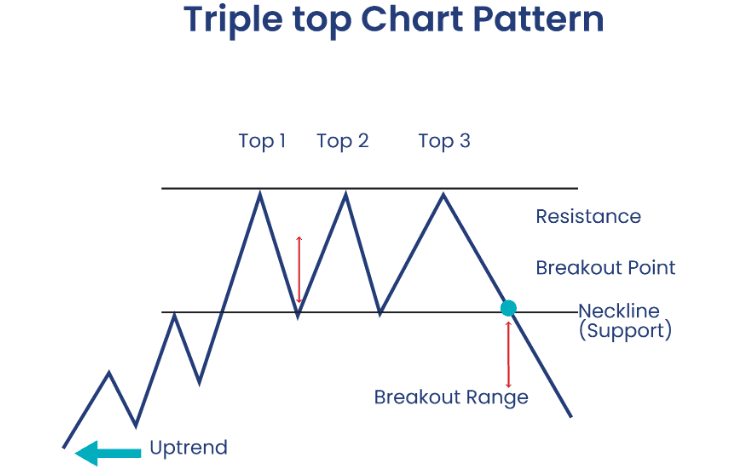
The Triple Top Reversal chart pattern belongs to the reversal pattern group and predicts a bearish trend that comes about at the end of an uptrend. It signals a potential reversal of the bullish trend into bearish. It consists of three equidistant peaks with similar highs, where each peak is followed by a decline. The pattern is confirmed when the asset price breaks below the support level established at the low points between the peaks.
The Triple Top Reversal is a chart pattern traders use to identify that an uptrend is losing steam and that a downward move is expected. It’s one of the most trusted, well-known patterns within technical analysis, usually accompanied by an increase in trading volume during the breakout.
Interpretation
The Triple Top Reversal chart pattern conveys the following important insights:
1. Formation: There are three peaks formed with similar highs.
2. Volume: Volume generally diminishes with each rally, which indicates a loss of buying momentum.
3. Breakout: Only after the third rally did the price break down the neckline and thus confirm the trend change.
4. Target: The distance between the peak and the neckline is usually the approximate target below the breakdown point.
5. Confirmation: Stop-loss orders should be placed above the high of the third peak, and a move below the neckline with increased volume confirms the pattern completion.
How Do You Identify and Trade a Triple Top Reversal Chart Pattern?
Now that we have understood the basics of the Triple Top Reversal chart pattern, we will learn how to identify and trade it step by step.
Step 1: Identification of the Pattern
- Observe the chart and look for three peaks (tops) nearly at the same price level.
- The volume should slightly decrease with each subsequent top to indicate a weakening in buying momentum.
- At least 7-8 candles should be between the tops to form a reliable pattern.
Step 2: Drawing the Neckline
- Join these two support levels lows, which have formed between these tops, through a trend line.
- This line is the neckline that becomes the key support level.
Step 3: Wait for Breakdown
- The trade signal is generated when the price breaks below the neckline after the formation of the third top.
- The breakdown should occur with a significant increase in volume.
Step 4: Place the Trade
- Enter a short position immediately on the close of the price below the neckline.
- This completes the pattern, which further confirms the start of the downtrend.
Step 5: Set Stop-Loss (SL)
- Place the stop-loss higher than the recent peak—the third top.
- Your position sizing and stop loss should be according to your risk tolerance.
Step 6: Profit Objective Determination
- Measure the distance from the top’s highest point to the neckline.
- Extend this distance downwards from the point of breakdown to set your profit target.
Step 7: Apply Trailing Stop-Loss
- As the price moves in your favor, adjust the stop-loss to lock in profit.
Read Also: Three Outside Down Pattern
Example
Let’s understand how to take a trade using a Triple Top Reversal chart pattern with the help of a practical example. In this example, you will learn how to identify stop loss and target levels.
Below is the chart of Advanced Micro Devices Inc. for a 1-Day time frame.
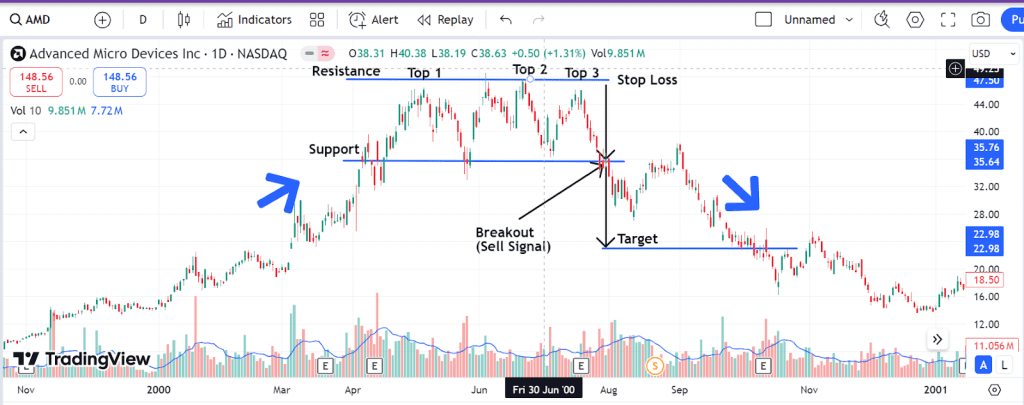
We see that the stock price has made three consecutive peaks, with a high of approximately USD 48. Once the stock price breaks below the support level of USD 35, we see a downward trend, and the stock makes a low of approximately USD 23, which is approximately equal to the distance between support and the peak.
Advantages of Triple Top Reversal Chart Pattern
The advantages of the Triple Top Reversal chart pattern are:
- Clear Signal of Trend Reversal: The Triple Top Reversal pattern strongly indicates a trend change from a bullish uptrend to a bearish reversal. It helps the traders identify potential selling points, thus reducing the risk of holding an asset when prices drop.
- High Accuracy: It’s a reliable pattern that becomes even more accurate when used with confirmations from volume and other technical tools.
- Easy to Identify: The three-peaked pattern is very distinct and can be easily seen by someone just looking at the chart for patterns. This simplicity allows every trader to identify the chart pattern easily.
- Well-defined Entry and Exit Points: Trading the Triple Top Reversal offers clear-cut entry and exit points and helps simplify the trading process.
- Widely Recognized and Trusted: This pattern is so well-known and well-studied in the technical analysis world that it carries a lot of credibility along with it.
Limitations of Triple Top Reversal Chart Pattern
The limitations of the Triple Top Reversal chart pattern are:
- Time-Consuming: The Triple Top Reversal chart pattern will require some time to develop, and therefore, a trader can sometimes miss some of the short-term trading opportunities.
- Can Give False Signals: Like every other technical pattern, the Triple Top Reversal can sometimes give false signals, especially in volatile markets. Therefore, the trader ought to confirm pattern signals through other indicators.
- Limited in Strong Trends: Triple Top Reversal may not form in strong, trending markets. It works better when the markets have started showing weaknesses or consolidation.
- Not Always Perfectly Symmetrical: Sometimes, the three peaks are not exactly level, which can cause misinterpretation. Traders have to be cautious and see the overall market context.
- Dependent on Volume Confirmation: Pattern confirmation is often dependent on volume confirmation, which is subjective. Without adequate volume, the pattern would most probably give false signals.
Read Also: Broadening Top Chart Pattern
Conclusion
The Triple Top Reversal chart pattern is one of the most reliable chart patterns for determining a potential bearish reversal. Prices do not quite break above resistance in three successive attempts, which means the uptrend is about to end. Specifically, the pattern is among the most effective when combined with other technical indicators. The pattern also provides clearly defined entry and exit points, helping a trader become consistent.
Again, as with all chart patterns, the Triple Top must be utilized along with a broader market analysis. The interactions between market sentiment and/or other external news events can affect the pattern’s performance. Traders should always be on their guard, ensuring risk management strategies are in place in case the signals are false or some unexpected events occur.
Frequently Asked Questions (FAQs)
What is a Triple Top Reversal chart pattern?
Triple Top Reversal chart pattern is a bearish chart pattern that indicates a change of trend from bullish to bearish, indicating buyers are losing control.
Can the Triple Top Reversal pattern fail, and what to do if it does?
Yes, the pattern can give false signals if the price rises above the resistance level after giving a breakout. Traders should consider exiting positions to reduce losses in such cases.
How accurate is the Triple Top Reversal chart pattern?
It is considered a reliable pattern, but it is not 100% accurate and should be utilized with other indicators and risk control strategies.
What does a completed Triple Top Reversal chart pattern indicate?
A completed Triple Top Reversal chart pattern would indicate a further decline in price. The resistance level has been tested several times without a breakout, conveying a weakening buyer momentum.
Disclaimer
The securities, funds, and strategies discussed in this blog are provided for informational purposes only. They do not represent endorsements or recommendations. Investors should conduct their own research and seek professional advice before making any investment decisions.