| Type | Description | Contributor | Date |
|---|---|---|---|
| Post created | Pocketful Team | Jul-16-24 | |
| Add new links | Nisha | Mar-18-25 |
Read Next![]()
- What Is Leverage in the Stock Market?
- Common Trading Mistakes Beginners Make (And How to Avoid Them)
- How to Pledge ETFs for Margin in India
- What Is Expiry Day Trading?
- Best ETF Platforms for Trading and Investment in India 2026
- What Is Strike Price in Options Trading?
- What is Speculative Trading?
- What is Revenge Trading?
- What Is Time Decay in Options?
- What are Candlestick Patterns? 38 Candlestick Patterns Every Trader Must Know
- How to Read Stock Charts: A Beginner’s Guide to Chart Analysis
- What is Gold Trading?
- Top Algo Trading Programming Languages in 2026
- What is Short-Term Trading Vs Long-Term Trading Strategies?
- NSE Algo Trading Rules for Retail Traders in India
- What is a Harami Candlestick Pattern?
- What is Average Traded Price in Stock Market
- What is MIS in Share Market?
- 7 Common Mistakes in Commodity Trading New Traders Must Avoid
- Brokerage Charges in India: Explained
Correlation vs Regression: What’s The Difference?
Written by : Pocketful Team
|Updated by : Pocketful Team
Published on : 16th July 2024
|Updated on : 18th March 2025
Financial markets have become increasingly complex due to the availability of huge quantities of financial data. In order to process financial data, finance professionals have adopted various statistical tools. Statistical tools can be used to analyze market trends and the relationships between two variables and, most importantly, gain an edge over competitors. Two key tools in this regard are correlation and regression.
In today’s blog, we will learn about correlation and regression, their uses, types, and the differences between them.
What is Correlation?
It measures the strength and direction of a linear relationship between two variables and shows how two things change together but does not always mean one causes the other. Correlation can be used in stock markets to explain how stock prices and any other variable move relative to each other. It also finds applications in portfolio management.
A strong correlation means that variables change together consistently. A weak correlation means the changes are less consistent. Furthermore, correlation does not mean causation. The fact that two things change simultaneously does not mean that one is the cause of the other. There could be a third factor affecting both variables. Correlation is computed as correlation coefficient, denoted as r, with values between -1 and +1.
Types of Correlation
Different types of correlation are:
- Linear correlation: Two variables have a straight-line relationship between them. A scatter plot of the data would show a clear linear trend. The Karl Pearson correlation coefficient is used to measure linear correlations.
- Nonlinear Correlations: The relationship between two variables is not a straight line. The data might show a curve. Spearman’s rank correlation coefficient is used to measure nonlinear correlation.
Interpretation of correlation values is listed below:
- Positive Correlation: In this case, two variables change together in the same direction. The value of both variables increases or decreases simultaneously. The value of r ranges between 0 and +1.
- Negative Correlation: In this case, two variables change together but in opposite directions. An increase in one variable will cause a decrease in the other variable and vice-versa. The value of r ranges between 0 and -1.
- Zero Correlation: In this case, the two variables move independently, i.e., a change in one variable doesn’t predict any change in the other. The value of r is approximately equal to 0.
The most widely used methods for calculating the coefficient of correlation are Karl Pearson’s Coefficient of Correlation and Spearman’s Rank Correlation Coefficient.
Karl Pearson’s correlation coefficient (r) is calculated as:
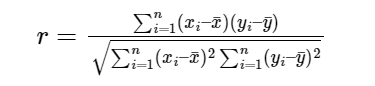
where,
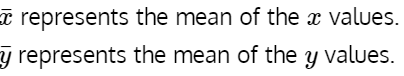
Spearman Rank correlation coefficient (r) is calculated as:
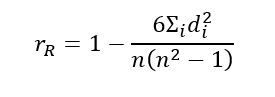
Where,
d = Difference between two ranks
n = Number of observations
Uses of Correlation
Correlation has a wide range of applications across various fields. Some of the key uses are stated below:
- In science, correlation analysis helps researchers examine possible connections between variables.
- Businesses can use correlation to make better decisions. For example, analyzing the correlation between marketing campaigns and sales figures to improve advertising strategies
- Psychologists also use correlation to analyze the behavioral patterns and personality traits of individuals.
What is Regression?
Regression Analysis is a statistical technique that helps you understand the relationship between one dependent variable (the one you want to predict) and one or more independent variables (the ones you think can affect the predicted variable).
With the help of regression analysis, you create a mathematical model that analyzes the relationship between the variables. Once the model is developed, it can be used to predict the value of the dependent variable based on the value of an independent variable.
Read Also: XIRR Vs CAGR: Investment Return Metrics
Types of Regression
Linear Regression: It creates a model that fits a straight line through the data points to estimate the relationship between a dependent variable and one or more independent variables. It best fits situations where the relationship between variables is linear. It is further divided into two types, i.e., simple linear regression and multiple linear regression.
Polynomial Regression: It is used when the relationship between variables is nonlinear and can be represented with the help of a curve.
Logistic Regression: It is used to solve classification problems with two possible outcomes. Logistic regression estimates event probability using independent variables.
Each type of regression can be represented using the equations given below:
Simple Linear Regression
Y = a + b X,
where,
Y = dependant variable
X = independent variable
a = y-intercept
b = slope
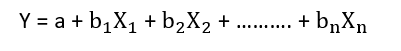
Multiple Linear Regression
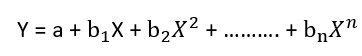
Polynomial Regression
Uses of Regression
- Businesses use regression to forecast future sales using past data and variables such as advertising budget, seasonal effects, and economic trends. This helps manage inventory and allocate resources.
- Medical professionals use regression analysis to identify risk factors for diseases and determine the probability of diseases.
- Banks and other financial institutions rely on regression analysis for several purposes, such as predicting stock prices, estimating investment risks, and creating models for loan defaults.
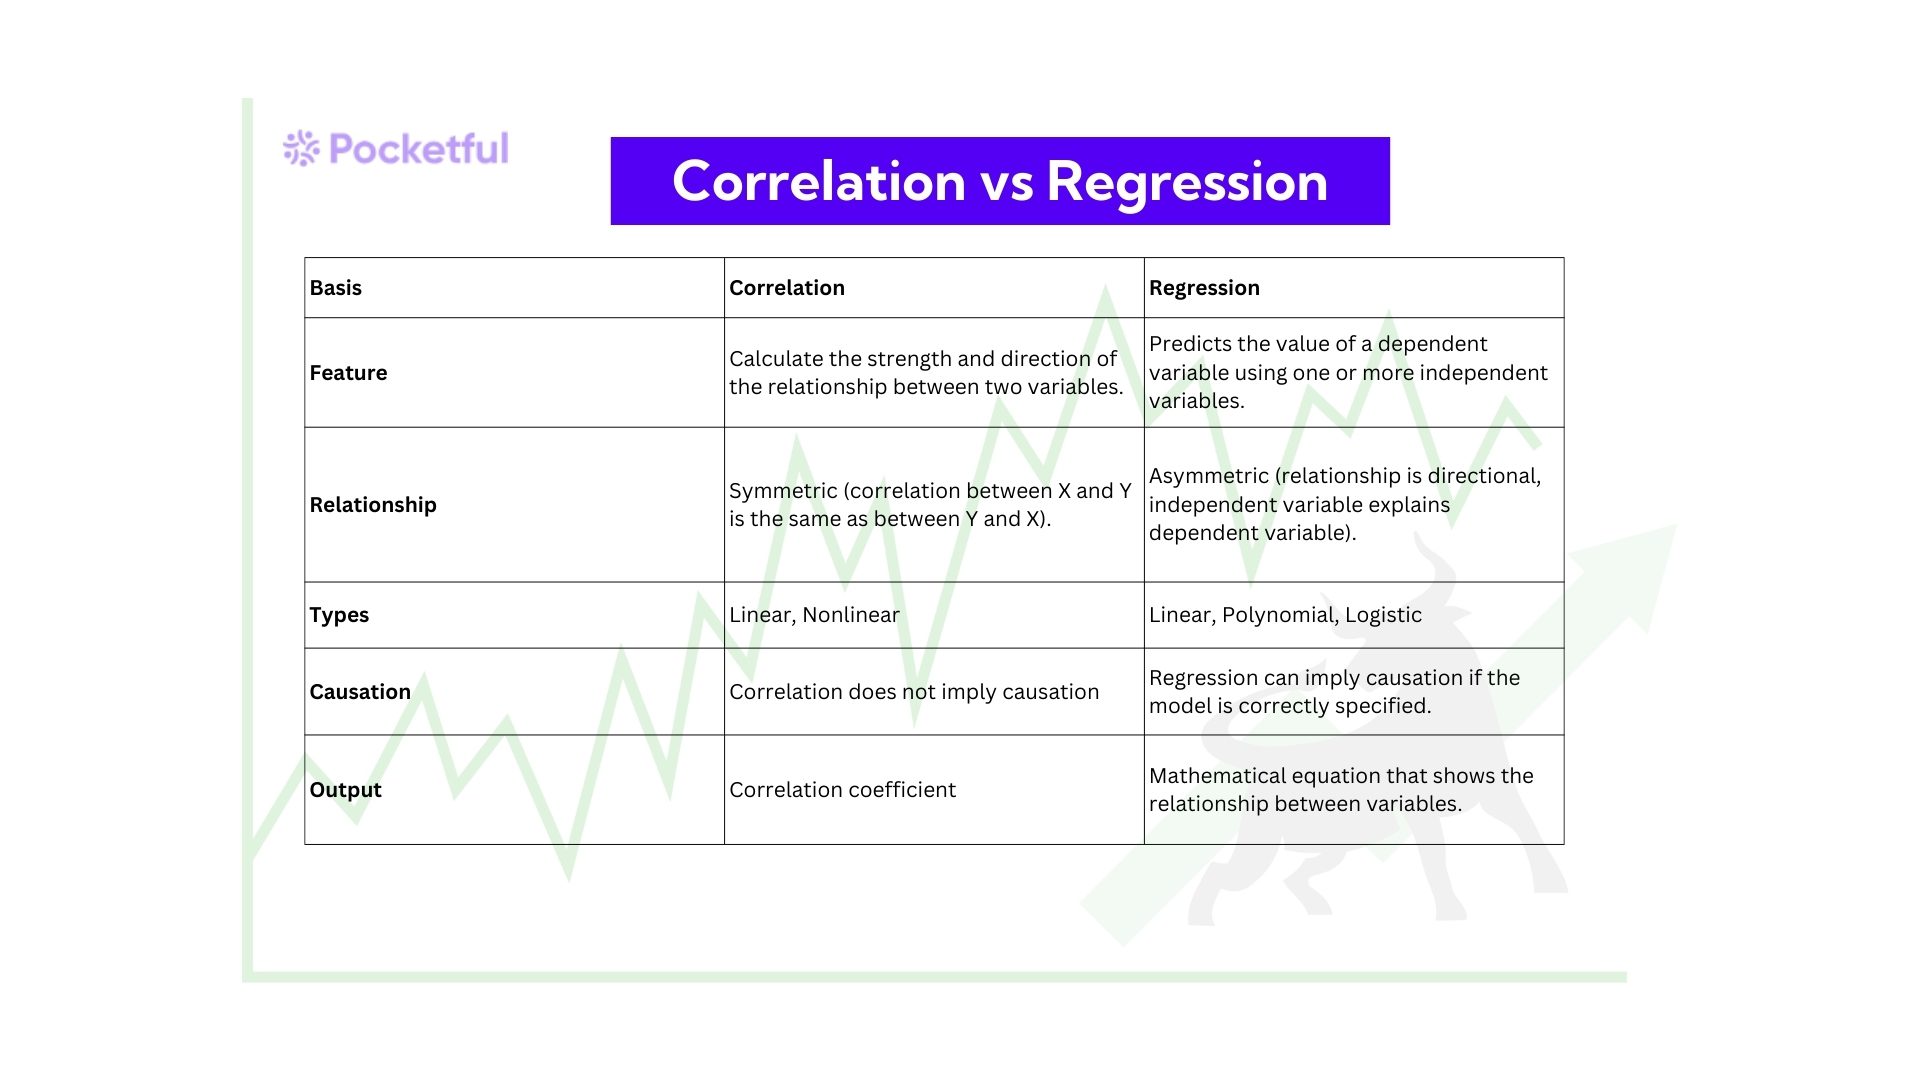
Difference Between Correlation and Regression
| Basis | Correlation | Regression |
|---|---|---|
| Feature | Calculate the strength and direction of the relationship between two variables. | Predicts the value of a dependent variable using one or more independent variables. |
| Relationship | Symmetric (correlation between X and Y is the same as between Y and X). | Asymmetric (relationship is directional, independent variable explains dependent variable). |
| Types | Linear, Nonlinear | Linear, Polynomial, Logistic |
| Causation | Correlation does not imply causation | Regression can imply causation if the model is correctly specified. |
| Output | Correlation coefficient | Mathematical equation that shows the relationship between variables. |
Read Also: SIP in Stocks vs SIP in Mutual funds?
Conclusion
To summarize, choosing the right statistical tool depends on the research task. If you want to understand the relationship between two variables, correlation can be a good starting point, and if you want to build a prediction model, then regression is the way to go. They have different objectives and characteristics.
In relation to stock markets, correlation can be used to find relationships between stock prices and other market variables. On the other hand, regression analysis can be performed to predict stock prices based on the set of independent variables. However, it is advised to consult a financial advisor before making any investment decision.
Frequently Asked Questions (FAQs)
01
What is the difference between correlation and regression?
Correlation measures the strength and direction of a linear relationship between two variables. In comparison, regression creates a model to forecast the value of a dependent variable depending on one or more independent variables.
02
What does the correlation coefficient tell us?
These coefficients range from -1 to +1.1. Closer to -1 shows a strong negative correlation.2. Closer to 0 shows no linear correlation3. Closer to +1 shows a strong positive correlation
03
What are residuals in regression analysis?
Residuals are the differences between the observed values and the predicted values of the dependent variable. They depict how well the model fits the data.
04
What are the limitations of correlation and regression?
Correlation can’t be used to imply causation, which means it doesn’t explain which variable causes the other variable to change. Regression models are based on the past data and may not be able to forecast the future outcomes properly.
05
When should I use Spearman’s Rank Correlation instead of Karl Pearson’s Coefficient?
Spearman correlation coefficient is used when the data under consideration doesn’t have a normal distribution and uses nonlinear data, whereas Karl Pearson correlation coefficient is used for measuring linear correlation.
Disclaimer
The securities, funds, and strategies discussed in this blog are provided for informational purposes only. They do not represent endorsements or recommendations. Investors should conduct their own research and seek professional advice before making any investment decisions.
